

Social listening, sometimes called social media listening, is the practice of tracking and analysing public online conversations to understand what people say about a brand, product, or industry across social media, forums, blogs, and news.
It goes beyond simply tracking mentions or counting likes. At its core, social listening is about understanding the intent, sentiment, and context behind what people say online, then using that understanding to inform business decisions.
A straightforward definition: social listening is the process of collecting and analysing public online conversations to extract actionable insights about your audience, your brand, and your market.
These two terms are often used interchangeably, but they describe different activities.
Social monitoring is reactive. It tracks specific mentions, hashtags, or keywords and alerts you when they appear. It answers the question: what is being said?
Social listening is strategic. It analyses patterns, trends, and sentiment across a much broader dataset to answer a deeper question: what does it mean, and what should we do about it?
Think of monitoring as reading individual messages and listening as understanding the full conversation.
Most modern social listening platforms combine both capabilities, but the strategic value comes from the listening layer, not the monitoring layer.
Social listening platforms operate through a combination of data collection, natural language processing, and sentiment analysis.
The platform continuously crawls and ingests data from connected sources. These typically include major social networks such as Facebook, Instagram, X (formerly Twitter), LinkedIn, YouTube, and TikTok, as well as forums like Reddit, blogs, news publications, and review sites. The volume of data processed is enormous. A single platform may analyse millions of posts per day across dozens of languages.
Raw social data is noisy and unstructured. Natural language processing (NLP) is the technology that makes sense of it. NLP models identify the topics being discussed, classify the language used, detect sarcasm and nuance, and group related conversations together. This is what separates a useful insight from a wall of irrelevant text.
Sentiment analysis classifies the emotional tone of a conversation. Is this post positive, negative, or neutral? Is the author frustrated, excited, or confused? Advanced sentiment models go further, identifying specific emotions, urgency signals, and purchase intent within conversations.
Once data is collected, processed, and classified, the platform presents it in a usable format. This might be a dashboard showing trending topics, a report on brand sentiment over time, an alert when a crisis is emerging, or a breakdown of what your audience cares about most in a given week.
The applications of social listening span almost every business function. Here are the most common and valuable use cases.
Understanding how your brand is perceived in the market is fundamental. Social listening gives you a real-time view of brand sentiment, share of voice relative to competitors, and how that perception shifts in response to campaigns, news events, or product changes.
You can apply social listening to any brand, not just your own. Monitoring competitor conversations reveals what their customers love, what they complain about, and where there are gaps in the market your brand can occupy.
Social listening surfaces emerging trends before they reach mainstream media. Brands that identify a trend early have a significant advantage in terms of content creation, product development, and campaign positioning.
The language your audience uses, the topics they care about, the questions they ask and the frustrations they express are all visible in social data. This is some of the richest audience intelligence available, and it updates continuously without the need for surveys or focus groups.
Social listening provides a real-world measure of how a campaign is being received. Beyond impressions and clicks, it tells you whether your message is resonating, being misunderstood, or generating unintended associations.
When sentiment drops sharply or a negative topic spikes suddenly, social listening platforms can trigger alerts that give brands a critical window to respond before a situation escalates. Speed of response is often the determining factor in how a brand crisis plays out.
Consumers regularly discuss product problems, feature requests, and unmet needs in public forums. Social listening transforms that feedback into a structured input for product development teams.
The volume of online conversation has grown exponentially over the past decade, and so has its influence. A single viral post can shift brand perception overnight. A trend that starts on TikTok can be mainstream within 72 hours. A product complaint shared on Reddit can reach tens of thousands of people before a brand's customer service team even sees it.
In this environment, brands that are not actively listening are operating with a significant blind spot. They are making marketing decisions based on historical data, internal assumptions, and periodic research rather than the live, unfiltered signal that is available to them at any moment.
Social listening closes that gap. It gives marketing, communications, and product teams access to a continuous stream of real-world intelligence that improves the quality of every decision they make.
There is also a growing relevance for AI-powered marketing workflows. Most social listening tools stop at insight. They tell you what your audience thinks but leave the gap between understanding and action entirely in your hands. That gap is where most of the value gets lost. Brands receive a report, hold a meeting, brief an agency, and by the time creative is produced the trend has moved on.
The most advanced implementations of social listening close that gap entirely. As brands increasingly use AI to generate content and advertising creative, social listening provides the richest possible input: real conversations, real language, real intent, sourced directly from the audiences brands are trying to reach. For Shopify merchants, DataVinci takes this further by turning social listening data directly into on-brand ad creative. No brief, no agency, no lag. It is the only tool that moves from insight to action in a single workflow.
Understanding social listening means understanding the metrics that platforms use to quantify what they find.
Share of voice measures the proportion of total online conversation in your category that mentions your brand versus competitors. It is expressed as a percentage and gives a clear picture of brand visibility relative to the market.
Net Sentiment Score® is a measure of overall brand sentiment calculated by subtracting the percentage of negative mentions from the percentage of positive mentions. A score above zero indicates net positive perception. listening247 coined the methodology and trademarked the name Net Sentiment Score®, which has since been peer-reviewed and published in academic literature, providing a more reliable and independently validated measure than simple positive/negative ratios.
The raw count of how many times a brand, product, or topic is mentioned within a given time period. Volume alone is rarely meaningful but is useful in context, particularly when tracking spikes that indicate news events, viral moments, or emerging issues.
A breakdown of mentions by emotional classification: positive, negative, neutral. More advanced platforms add secondary layers such as emotion type (joy, anger, surprise) or intent signals (purchase intent, churn risk).
A categorisation of what is being discussed. For a consumer brand, this might show that 40% of conversations relate to product quality, 25% to customer service, 20% to price, and 15% to packaging. This distribution is a map of what your audience actually cares about.
Beyond the mention itself, reach measures how many people potentially saw a piece of content. Engagement measures how many interacted with it. These metrics help distinguish between a high-volume low-impact conversation and a lower-volume high-influence one.
Social listening is not sector-specific. The underlying methodology applies wherever public online conversation exists, but the applications vary by industry.
For FMCG brands, otherwise known as CPG (consumer packaged goods), social listening tracks product reception, monitors retailer conversations, identifies emerging consumer trends, and provides early warning of product quality issues before they reach customer service queues.
Fashion brands use social listening to track trend cycles, monitor influencer-driven conversation, measure the impact of drops and campaigns, and understand how brand positioning is perceived across different audience segments.
In a heavily regulated sector where brand trust is everything, social listening provides a real-time measure of customer sentiment and flags reputational risks early. It is also used to monitor competitor positioning and regulatory discussions.
Audience sentiment tracking, content reception monitoring, and talent perception analysis are all standard applications for media companies with active social audiences.
Multi-client agencies use social listening platforms to manage brand intelligence across multiple accounts simultaneously, generating insights and creative briefs from audience data rather than assumptions.
Not all platforms are equal. When evaluating social listening tools, the following criteria matter most.
Data coverage: Which sources does the platform monitor? The breadth of data collection directly determines the quality of insights. A platform that covers only Twitter and Instagram will miss significant conversation happening on Reddit, YouTube, and forums.
Language support: If your audience is global, you need a platform that analyses sentiment and topics accurately across multiple languages, not just English.
Sentiment and topic accuracy: Sentiment and topic classification are harder than they look. Sarcasm, colloquialisms, and industry-specific language all challenge generic models. Look for platforms that publish accuracy benchmarks and offer industry-specific model tuning. A credible platform should commit to a minimum 80% F1-score for both sentiment and topic accuracy across any language. Separately, brand accuracy (sometimes called relevance) measures how much of the data collected actually relates to your brand rather than irrelevant noise caused by homonyms and ambiguous terms. Look for platforms that achieve over 90% relevance, as high noise levels make insights unreliable regardless of how accurate the sentiment model is.
Real-time capability: For crisis monitoring and trend detection, the speed of data ingestion matters. Some platforms operate on a 24-48 hour delay. Others provide near real-time data.
Insight depth: Can the platform tell you not just what is being said but why, and by whom? Audience segmentation, topic clustering, and intent detection separate basic monitoring tools from genuine intelligence platforms.
Output and integration: How does the platform present its findings? Can it connect to your existing workflows, reporting tools, or content production systems?
As covered earlier, monitoring and listening are related but distinct. Monitoring is about catching mentions. Listening is about understanding meaning. The two are often bundled together but should not be treated as synonymous.
Social listening is valuable at any scale. Even a brand with modest mention volumes benefits from understanding the sentiment and themes within those conversations. And listening to competitor and category conversations provides market intelligence that is entirely independent of your own brand's mention volume.
Raw social data is noisy, and homonyms are a particular problem. A brand name that shares a word with common everyday language will pull in enormous volumes of irrelevant content. But this is a platform quality problem, not an inherent limitation of social listening. Well-built platforms use advanced NLP and relevance filtering to produce clean, reliable datasets, committing to minimum accuracy benchmarks rather than leaving it to chance. listening247 commits to a minimum 80% F1-score for sentiment and topic accuracy in any language, and over 90% brand relevance, both validated against third-party benchmarks.
Social listening complements rather than replaces traditional research methods. What it offers is speed, scale, and unprompted honesty. Survey respondents know they are being studied. Social media users do not. That changes what they say and how they say it.
If you are new to social listening, the most effective way to start is by defining a clear scope before selecting a platform.
Start with these questions: What brand or product do you want to monitor? Who are your main competitors? What topics or themes are most strategically important to your business? What would you do differently if you had better audience intelligence?
The answers shape your listening strategy and prevent the common mistake of collecting vast amounts of data without a clear plan for acting on it.
Once you have defined your scope, set up your brand monitoring first, then layer in competitor tracking, then category and trend listening. Build from specific to broad rather than trying to monitor everything at once.
Review your first reports critically. Look for surprises. The most valuable social listening insights are almost always the ones you did not expect.
Social listening is one of the most powerful and underused tools available to modern marketers. It provides a direct, continuous feed of real-world intelligence about your brand, your audience, and your market, sourced from the conversations people are already having.
The brands that use it well do not just react faster. They make better decisions, create more relevant content, build stronger products, and understand their audiences in a way that no other research method can replicate.
If you are not listening, your competitors might be.

.png)
Most business merchants know the feeling. A post needs to go out. Something gets written, published, and hoped for. Maybe it lands. Maybe it doesn't. Either way, the same process repeats next week.
That’s not a content strategy. It’s survival mode. And it’s costing merchants more than they realise.
When listening247 took a look at how small to medium size businesses operated, how they typically created social media content, and where they were doing business, we knew we needed to take our web app of DataVinci and build it directly into Shopify.
So what is it? DataVinci is AI-Powered Social Campaign Automation for Shopify Merchants. It listens to real customer and competitor conversations while using your Shopify store data to turn conversations into content that actually connects.
Generic AI tools help with speed. But they still depend on the user knowing what to write about before anything gets created. The guesswork never actually goes away.
DataVinci works differently. It surfaces the top themes your audience actually cares about, then instantly generates campaign ideas, post captions, and images ready to publish. This is listening-to-ads. From real customer conversations to targeted social content, automatically.
The result is content built on insight, not instinct.
Everything Needed to Scale a Digital Presence
DataVinci is built to handle the full content workflow all within the Shopify interface so you don’t have to jump around your browser:
Bulk content generation. Create weeks of content in minutes. Generate multiple images and copy ideas at once, each tailored to different themes and customer insights.
Brand voice and style control. Set the brand's tone, visual style, and content guidelines once. Every post stays perfectly on-brand, automatically.
Multi-platform scheduling. Schedule to Instagram, Facebook, and X. Optimize timing for each platform without juggling multiple tools.
The difference shows up fast. Merchants in early testing are seeing real, measurable results:
10x faster output. Weeks of content created in minutes.
3x current ROAS. Content built from real customer conversations speaks directly to what audiences care about. That translates into double the return on ad spend.
90% lower creative costs. No agency. No freelancer. Just intelligent, high-performing content generated at scale.
DataVinci is launching on Shopify soon. A free forever plan will be available, making it possible for any merchant to get started with no upfront commitment.
Right now, a limited number of beta spots are open. This is the opportunity to get early access, shape the product with real feedback, and start creating content that actually performs before the full launch.
Beta testers get in first. Spots are limited.
Sign up for the beta waitlist: https://www.listening247.com/datavinci

.png)
In the current noisy digital landscape, brands are constantly searching for new ways to connect with audiences and stand out in crowded markets. While traditional data and analytics, such as surveys and focus groups, have long been the backbone of marketing, there is a vast and often overlooked resource that holds the key to breakthrough ad concepts: everyday customer conversations.
At listening247, we believe the real power lies in mining these authentic interactions. Whether they happen on social media, review sites, or forums, these dialogues contain untapped insights that can transform your entire campaign strategy.
Traditional market research and surveys provide valuable information but are structured to provide long term, strategic benchmarks. However, they often miss the nuance and immediacy of real time dialogue. Conversations reveal not just what customers think, but how they feel and the specific language they use when discussing their problems. It’s dynamic.
This rich and unfiltered data is a goldmine for brands looking to create ads that truly resonate. When you understand the exact words and emotions your customers express, you can craft messages that cut through the noise and build genuine trust.
The challenge for many brands is how to efficiently capture and analyze the sheer volume of interactions happening every day. This is where AI powered platforms like listening247 come into play.
Our technology listens to thousands of online conversations to identify recurring themes and emerging trends. By transforming this raw data into hundreds of ready to run ad ideas, brands can rapidly test and deploy campaigns that reflect what customers are actually saying.
Imagine turning five core themes from your customer conversations into over 250 unique ad angles in just minutes. This scale and speed allow marketers to experiment and find the messages that truly move the needle.
Mining customer conversations offers several key benefits for modern brands:
While all business sizes and industries have this need to understand their customer better, small and mid sized businesses often face resource constraints that limit their ability to conduct deep market research. Using AI to automate the extraction of insights and generate creative concepts levels the paying field.
At listening247, we empower SMBs to harness their customers’ voices at scale. We turn everyday conversations into high-performing digital ads tailored for social media and other digital platforms by analyzing customer language, sentiment, and emerging trends to craft messages that drive engagement and sales. This approach not only drives better campaign performance but also builds stronger and more loyal customer relationships.
As we move further into 2026, the brands that succeed will be those that listen first and act fast. Customer conversations will become less of background noise and be a primary source of ideation. They will be the foundation of a successful marketing strategy.
Unlocking this hidden goldmine requires the right tools and a commitment to listening. By embracing conversational insights and AI driven automation, brands can create breakthrough ads that resonate deeply and deliver measurable results.
Are you ready to turn your customer conversations into your most valuable marketing asset?

.webp)
In peak season, the best gift isn’t always wrapped, it’s discovered through data. From nostalgia-driven gifting to AI-shaped shopping journeys, these are the seven holiday trends guiding how UK, EU, and US consumers plan, purchase, celebrate, and reset for the year ahead.
listening247’s analysis of 58,000+ public posts and conversations across X, Instagram, TikTok, Reddit, forums, and blogs, from the 2024 holiday season through today, reveals that the 2025–26 holiday season is dominated by seven themes:
Across the UK, EU, and US, positive sentiment toward the upcoming holiday season and brand-led experiences is strong, but a large neutral band signals opportunity. Brands that personalize, reduce friction, and clearly align their values with consumers’ priorities, from affordability and convenience to inclusivity and sustainability, will win both baskets and long-term loyalty.
Strategic takeaway: It is no longer enough to target broad segments; the advantage lies in targeting specific moments and mindsets across the season. Precision insight powers precision activation.
Shoppers are using AI gift finders (for example, tools like DreamGift or Genie by GiftList that recommend gifts based on a few questions), creator-curated guides, retailer wishlists, and social searches to match taste with budget.
“Dupes” (lower-priced alternatives that resemble premium or viral products, often discovered via social platforms and marketplace apps) are normalized, but quality signals such as reviews, user-generated content (UGC), and creator testing still drive purchase confidence.
Tiered gifting emerges as a key trend of the season, especially across UK and EU audiences but visible in the US as well. Shoppers are building gift “stacks” that combine one signature hero item with smaller add-ons such as practical stocking fillers, experiences (for example, tickets or vouchers), and small keepsakes.
What to do: Embed UGC and creator content into on-site recommendation widgets, such as “You might also like” or “Still deciding?” carousels on product and cart pages. Launch dynamic persona bundles such as gamer, home chef, skincare minimalist, or teen tech. Offer price-protected “gift match” guarantees to build trust.
Sources: Retail Technology Innovation Hub, StoryStream
Holiday shopping behavior concentrates at three points throughout the year:
US audiences lead Cyber sales while UK and EU see last-week click-and-collect surges.
What to do: Sequence communications by intent. Educate buyers in October and November through guides and comparisons while using Cyber week to convert into sales with transparent pricing and protection, and push convenience in late December with stock visibility, pickup options, and e-gift cards.
Sources: Photoshelter
Consumers prefer shareable, simple, and cozy experiences such as potluck dinners, themed movie nights, neighborhood light walks, small concerts, and workshops led by creators and influencers. Here “creator” can mean both social-first influencers and hands-on hosts (for example, a cooking class, crafting session, or mixology night). Social content rewards realistic, low-stress celebrations over polished perfection.
What to do: Package “event in a box” kits with playlists, décor bundles, local maps, and creator co-host nights. Provide downloadable checklists and templates for easy sharing.
Sources: listening247 social listening across TikTok, Instagram, and Reddit; creator economy analysis
Holiday food conversations center on easy prep, allergen-based food options such as gluten-free and dairy-free recipes while also staying budget-friendly. EU audiences emphasize local seasonal produce while US consumers over-index on shoppable recipe carts.
What to do: Pair recipes on your site or app with pre-built online shopping carts from your retail partners (for example, “add all ingredients to basket” with one click). Add “swap this for that” filters within the recipe or cart experience for allergen-friendly, budget, or dietary alternatives, and promote leftover ideas and storage tips to reduce waste.
Sources: Social video analysis and retail innovation coverage
Travel conversations highlight the need for flexible booking, transparent fees, and clarity on whether insurance options are worth it. Many travellers describe insurance as “worth it” for missed connections, medical issues, or disruption refunds. “Homecoming” storytelling, from small-town charm to family reunion content, performs strongly across all regions. European users specifically seek real-time transport updates amid local disruptions.
What to do: Promote flexibility upfront, provide live status updates, and curate close-to-home itineraries with local creators.
Sources: Reddit and forum analysis from listening247
Consumers are rejecting extreme resolutions in favor of small, steady habits such as 15-minute workouts, daily journaling, meal prepping, and sleep hygiene. UK and EU audiences embrace group challenges while US users lean toward app-based streak tracking and digital accountability.
What to do: Launch micro challenges with creator accountability bundles, starter kits, and develop adaptive, AI-personalized plans to track habits easily.
Sources: Behavior-change conversation analysis, Digital Defynd
Sustainability shows up as practical, not performative. Consumers embrace resale, rental occasion-wear, durable basics, and minimal packaging. Tone matters as well. It needs to be approachable and useful messaging to win consumer trust. EU discussions highlight circularity and resale, while the US maintains a focus on durability and long-term value.
What to do: Promote repair and resale programs, offer impact receipts, and provide packaging options or eco-delivery toggles.
Sources: Sustainability and fashion discourse, Vocast
Creators drive faster conversions with “I tested 5” or “what to actually buy” formats across Instagram and TikTok.
Social search is the new shopping assistant. Optimize captions and alt text for shopper queries such as “gift for dad under £50” or “last minute Secret Santa EU.”
Sentiment drivers include stock transparency, clear shipping cutoffs, authentic lifestyle content, inclusive representation, and smooth returns.
Friction points include hidden fees, late deliveries, unclear allergens, and inconsistent pricing between ad and cart.
This season isn’t about bigger lists but about smarter choices, simpler hosting, and more meaningful moments. With over 58,000 UK, EU, and US conversations analyzed across the last year, one truth stands out: when you know your audience deeply, targeting becomes effortless and performance follows.

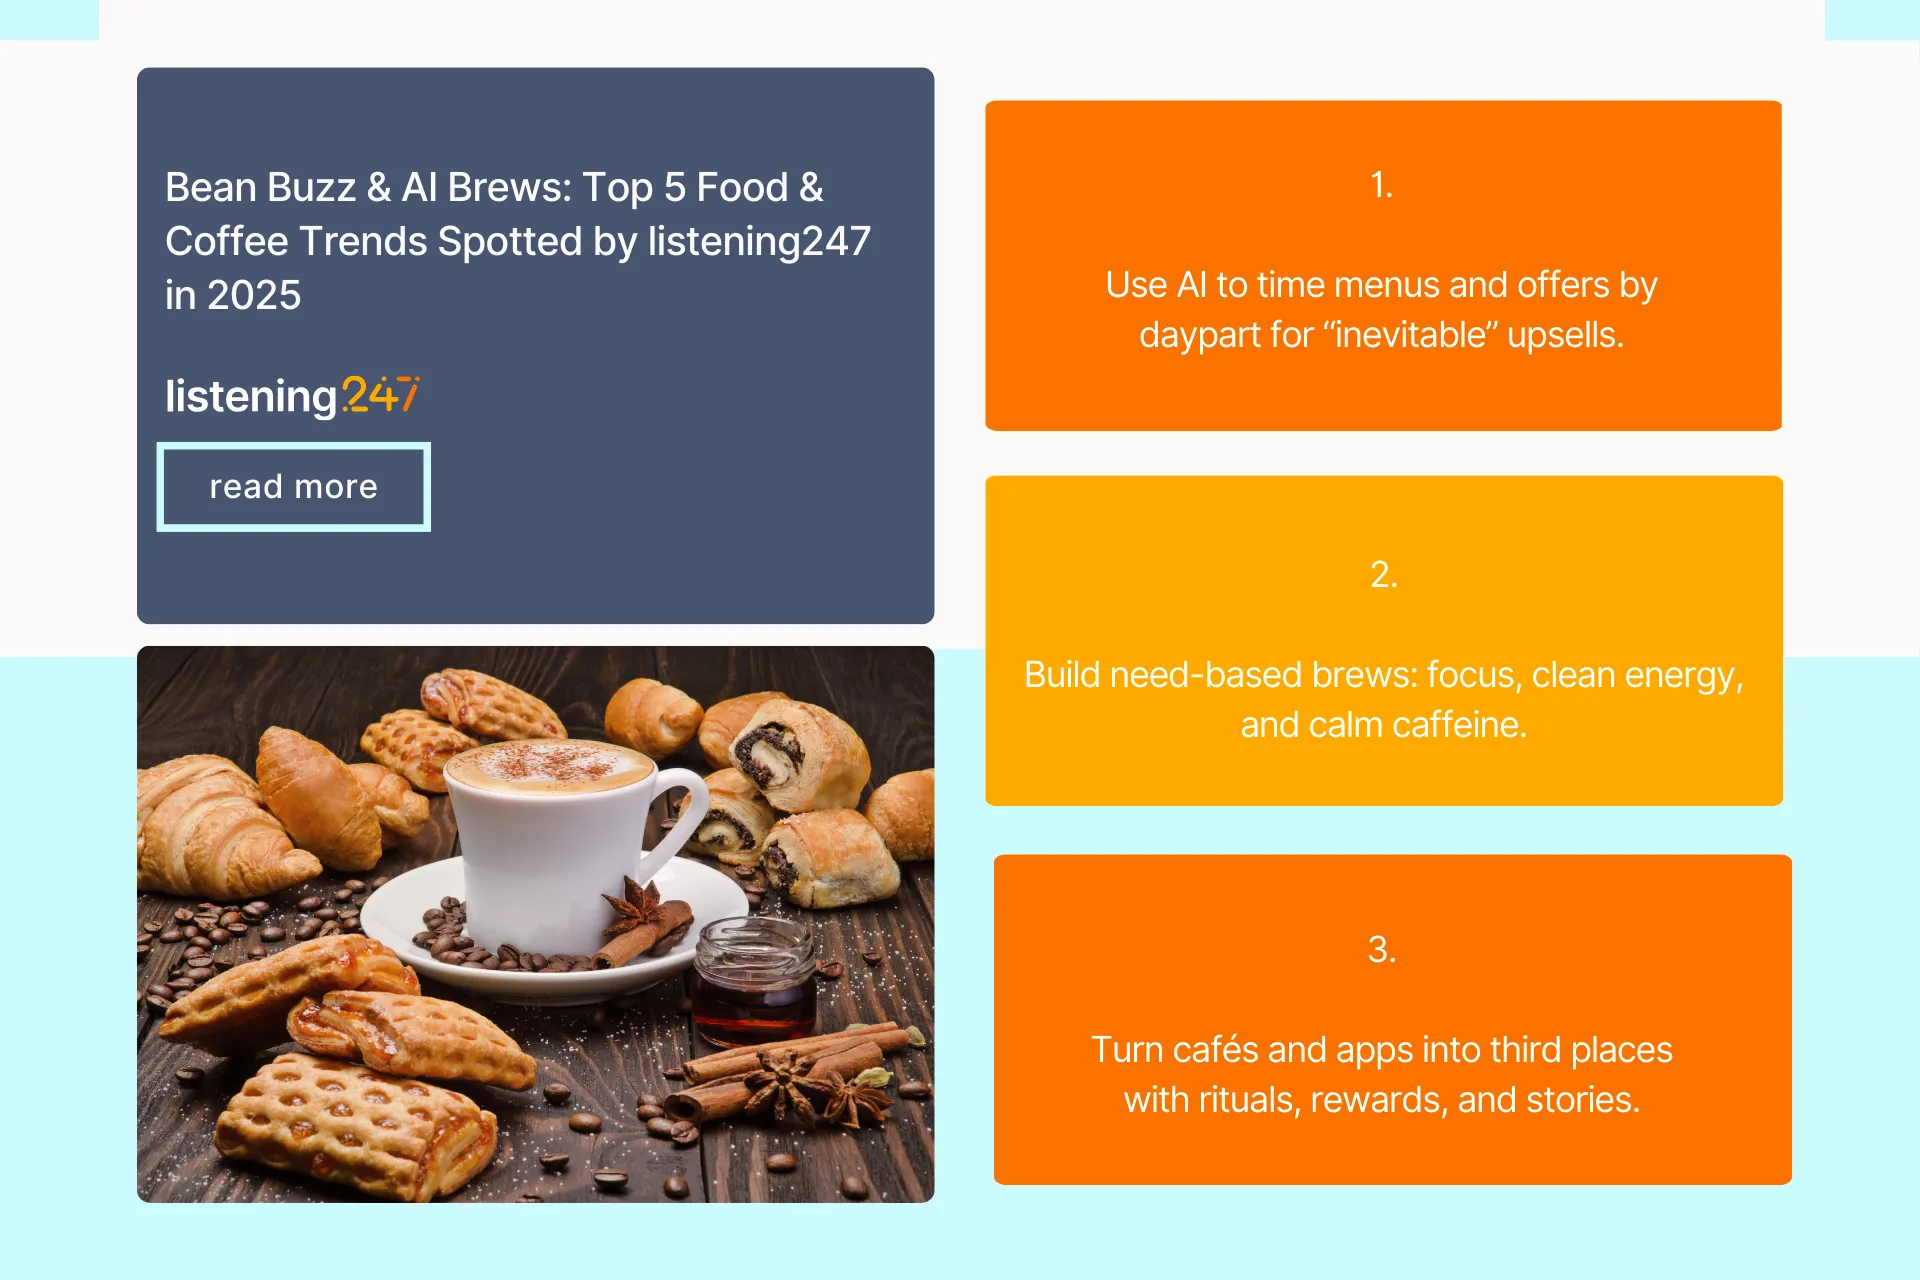
In food and coffee today, taste isn’t just on the tongue; it’s social, ritual, and smart.
From AI curated menus to functional brews, these are the top 5 trends shaping how people sip, snack, and share in 2025 across the UK, EU, and US.
listening247’s analysis of 47,000+ conversations from the second half of 2025 across X, Instagram, TikTok, Reddit, forums, and blogs reveals five key topics driving category discussion in coffee and food service:
Product innovation leads, reflecting a rising demand for specialty coffee, clean-label ready-to-drink (RTD) beverages, and playful flavor mashups. Coffee chains (for example, Starbucks, Costa, Pret) and specialty roasters are also innovating by using AI to personalize menus, forecast demand by daypart, and refine data-led marketing.
STRATEGIC TAKEAWAY: The better you know your customer, the easier it is to target them. Understanding micro moments (morning rush vs. afternoon slump), flavor tribes (nutty chocolate vs. bright citrus), and value signals (sustainability, wellness) turns broad audiences into highly targetable segments with higher conversion and loyalty.
Coffee chains and specialty roasters are adopting machine learning to:
Why it matters: precision targeting. When you know who buys what, when, and why, you tailor offers that feel inevitable, boosting attach rates and repeat orders.
Consumer talk around “focus,” “clean energy,” and “no jitters” is climbing across Reddit and TikTok. We see momentum for:
Strategic takeaway: segment by need (deep work mornings, gym pre or post, gentler PM pick me ups) rather than by demographic alone.
The “best taste” is emotional and digital. Loyalty apps and order ahead options are baseline; leaders differentiate with:
Strategic takeaway: map journeys by social channel and moment. For example: use TikTok to drive discovery with short-form content, then direct viewers to a free trial or introductory offer in your app. In-store, reinforce this with QR codes at the counter that capture feedback and unlock a discount, which you then use to tailor an ongoing subscription offer.
Coffee is culture; it anchors routines, identity, and “third place” belonging. A third place is a social space outside home (first place) and work (second place), where people feel comfortable, recognised, and part of a community.
Coffee spaces and rituals contribute to that sense of belonging through:
Strategic takeaway: lifestyle markers (remote work, fitness communities, eco conscious shoppers) predict beverage and food attach rates better than age brackets.
High-impact promotions do more than discount offers; they layer in story, exclusivity, and participation so customers feel part of something, not just getting a lower price:
Strategic takeaway: AI amplifies what resonates, optimizing message, audience, and timing across X, Instagram, and TikTok. The result: casual sippers become community members.
Across 47,000+ conversations from the second half of 2025 the UK, EU, and US coffee and food landscape is thriving at the intersection of craft and code. Brands that deeply understand customers, by moment, mindset, and micro culture, can target with precision, personalize at scale, and build communities where the “best brew” is sensory, digital, and deeply human.

.webp)
In alcohol, taste drives sales, but knowing your customer drives growth.
From premium rituals to mindful moderations, as dove into the habits of Gin drinkers in the UK, EU, and US, all based on public conversations across X, Instagram, TikTok, Reddit, forums, and blogs over the last 6–12 months, we identified the top 5 consumer trends shaping the Gin industry.
listening247’s analysis highlighted five dominant topics that matter to consumers for precision targeting:
Gin is uniquely positioned across all five: a canvas for mixology, a gifting favorite, a mindful-friendly base, a craft storytelling vehicle, and a creator economy staple. The takeaway is simple: the better you know your customer, what they value, when they drink, and how they discover, the easier and cheaper it is to target them.
Consumers talk about “worth it” bottles, limited editions, and gifting bundles - all which make them feel special. Gin performs strongly where botanicals, packaging, and glassware create perceived value. Clear use-cases (hosting, gifting, collecting) correlate with higher willingness to pay.
Targeting takeaways:
Source: In 2025, high-end spirits and premium mineral waters saw continued growth as younger consumers sought out quality over quantity (Forbes, 2025).
TikTok hashtag stream: #GinGifting (unboxings, bottle+glassware bundles): TikTok #GinGifting
Short-form videos fuel cocktail discovery; forums and blogs validate this by providing techniques and tips. Gin benefits from “five-ingredient max” serves and botanical exploration with citrus, herbal, floral, and tea-infused profiles surfacing as distinct flavor personas.
Targeting takeaways:
Source: According to the Brands Report 2025, gin continues leading bar menus globally, with brands like Tanqueray and Bombay Sapphire dominating cocktail lists, driven by flavor innovation and botanical exploration (Drinks International, 2025).
Blog Example: “3 citrus-forward gin serves in under 20 seconds” (short-form compilation frequently shared to IG/TikTok): A Couple Cooks – Gin Cocktails Note: long-running page, updated frequently and widely reshared in Reels.
TikTok hashtag stream: #5IngredientCocktails (simple builds, high saves): TikTok #5IngredientCocktails
Low/no-alcohol and sessionable serves are mainstreaming. Consumers want to keep the ritual without the excess. Gin-alternative bases and long G&Ts/spritzes are popular in weekday and wellness-aligned moments.
Targeting takeaways:
Source: Nearly half of U.S. consumers planned to drink less in 2025, with Gen Z leading the moderation movement, boosting low/no RTD categories, especially in gin (Forbes, 2025).
Blog Example: “Best non-alcoholic gins and long-serve ideas” (shared widely on social): The Spruce Eats – Best Non-Alcoholic Gins
TikTok hashtag stream: #SoberCurious (alternation, low/no builds): TikTok #SoberCurious
Sustainability discussions are rewarded when details are provided such as where the botanicals are sourced, regenerative practices, water/energy footprints, lightweight packaging, and refill options. Provenance storytelling, the act of communicating a product's or brand's history, origin, and journey as a compelling narrative, performs best when paired with verifiable progress.
Targeting takeaways:
Source: Provenance storytelling is central to the premiumization of gin, with brands emphasising botanicals sourced from distinct geographies and eco-friendly production (Drinks International, “Gin: Keeping It Real”).
Instagram hashtag stream: #SustainableGin (lighter glass, recycled content, energy/water claims): Instagram #SustainableGin
Promotions that educate outperform general discounts. QR-to-recipe journeys, flavor quizzes, creator-led tastings, and geo-targeted events move audiences from awareness to trial to repeat purchases.
Targeting takeaways:
Source: Consumer conversations on promotion-driven discovery highlight how education-first activations and storytelling outperform discounting (The Grocer, 2025).
TikTok hashtag stream: #CocktailQR (QR-to-recipe content flows): TikTok #CocktailQR
Instagram: #GinTastingEvents (geo-tagged tastings; UGC recaps): Instagram #GinTastingEvents
Alcohol’s growth in 2025 is shaped by consumers who want to be part of a story and simplicity. Gin is perfectly placed to win the moment: flavor forward, ritual ready, provenance proof, and creator friendly. With listening247’s AI, brands can turn noisy conversations into precise segments, so the right bottle, serve, and story meet the right person at the right time.
.webp)
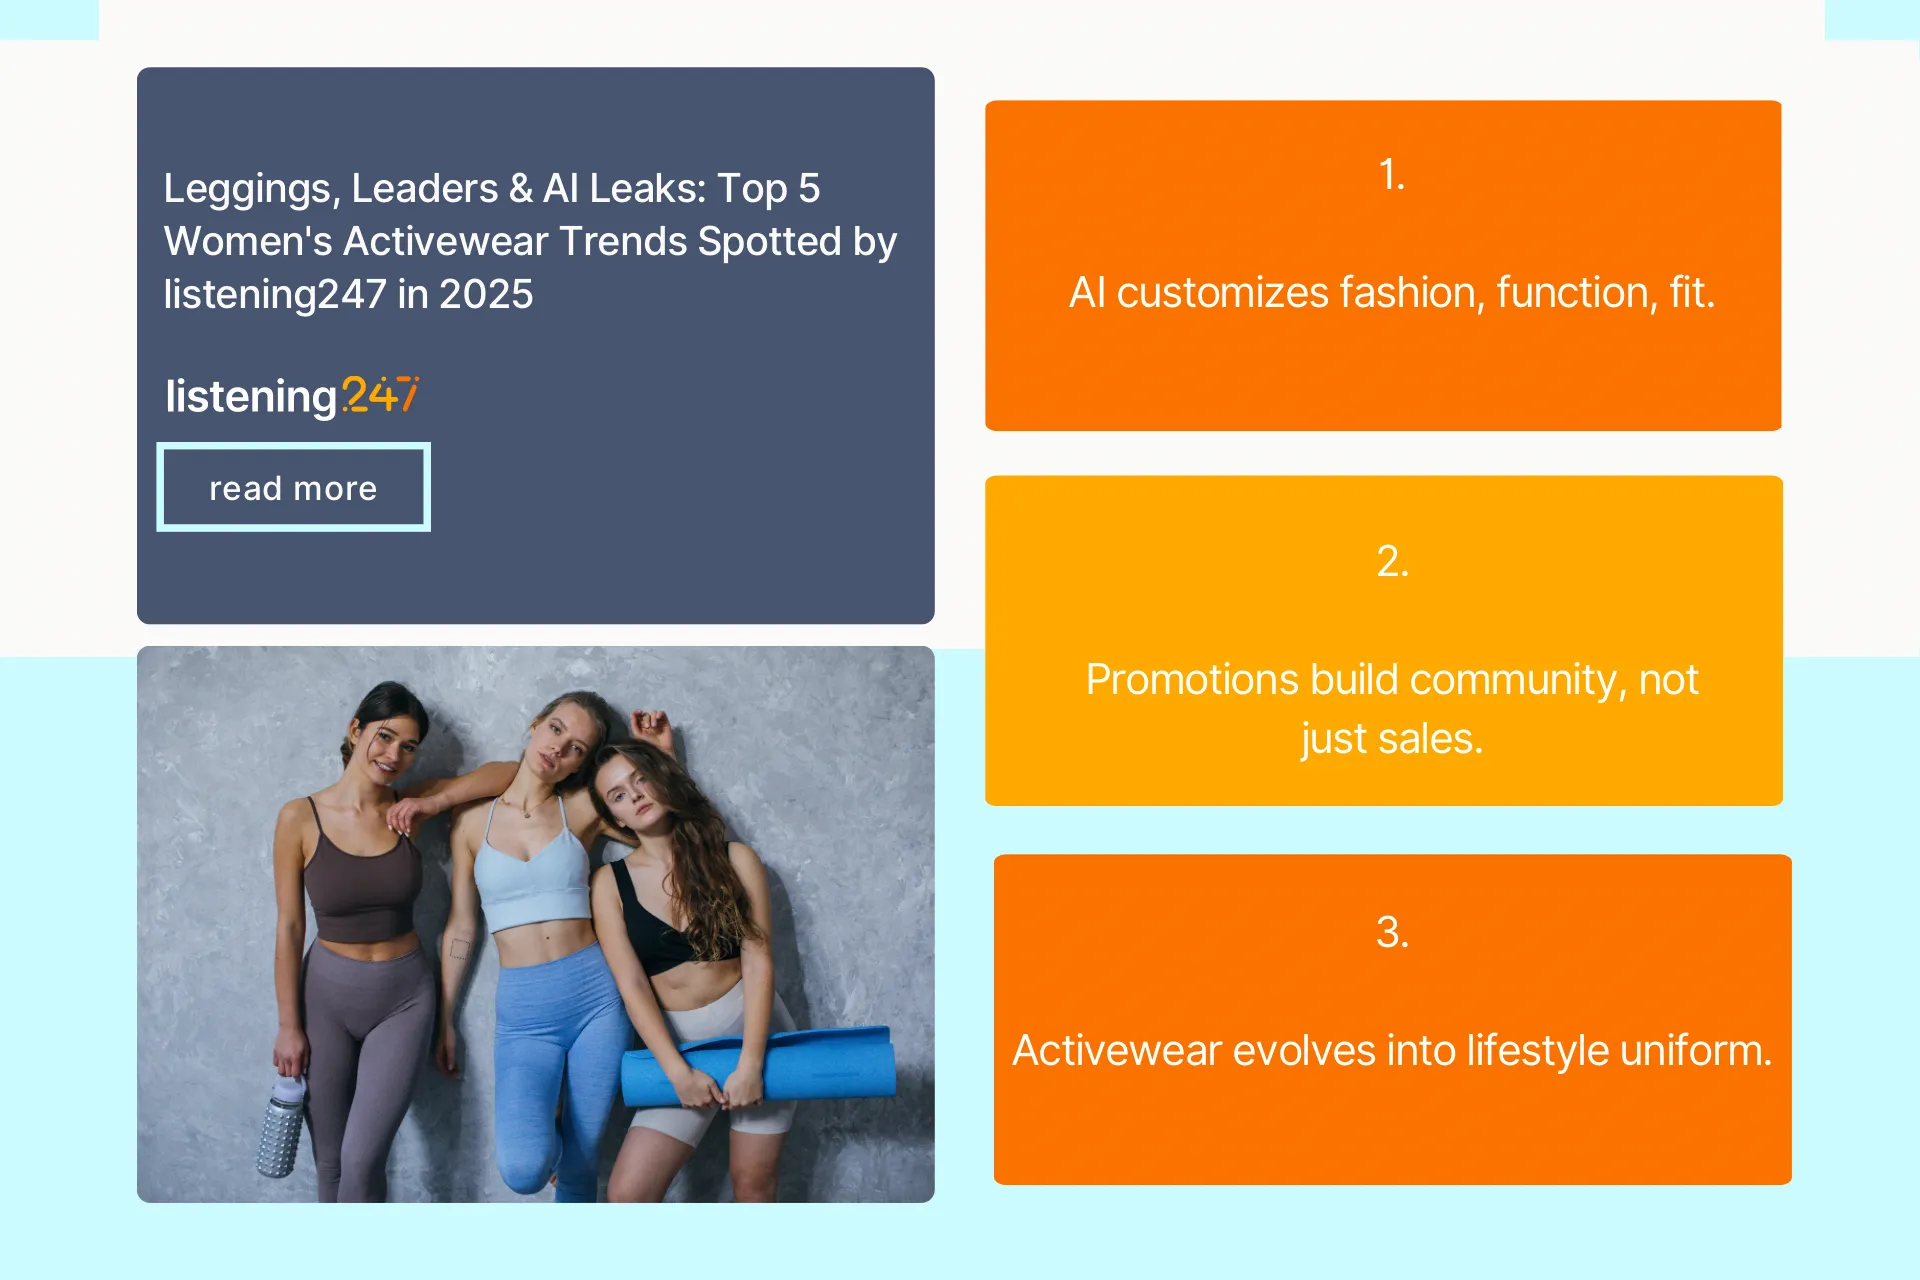
listening247’s analysis of 52,197+ conversations across Instagram, X, TikTok, YouTube, blogs, and forums reveals that in 2025, the women’s activewear industry is driven by five key topics:
Sports leads the discussion, reflecting the rise in women’s participation and their demand for performance-ready apparel, leading the way for brands to use AI to transform the industry with personalized user designs, smarter shopping, and data led marketing?
With the industry as a whole booming, consumers are embracing innovation, inclusivity, and the fusion of fashion and function; yet the presence of neutral sentiment signals an opportunity for brands to deepen engagement and build loyalty. The message is clear: consumers are invested, and the brands that stay ahead will be those that deliver comfort, tech, and meaningful connection.
The women’s activewear market is booming, set to skyrocket from $20.6B to $145.6B by 2032, driven by a surge in female participation in sports, growing health consciousness, and the rise of activewear as a lifestyle choice among millennials and Gen Z. Today’s consumers seek comfort, flexibility, and style tailored to their specific activities whether it’s running, yoga, or team sports; and brands are responding with tech-driven innovation.
AI is revolutionizing the game, enabling custom-fit designs through 3D body scanning, predictive movement analysis, and trend forecasting powered by machine learning. From adaptive fabrics to AI-generated collections, activewear is no longer just about function but rather it’s smart, stylish, and deeply personal.
Sources: (Fortune Business Insights) ; (The Brainy Insights) ; (TD Sportswear)
Activewear has evolved from a fashion trend into a full-blown lifestyle, with women leading the charge in blending comfort, style, and functionality into their everyday wardrobes. From the U.S. to China and Germany, global demand is being shaped by wellness, sustainability, and a desire for clothing that feels as good as it looks. Luxury fashion is also embracing the shift, with brands like Fendi and Versace launching athleisure lines.
Meanwhile, AI is accelerating this fusion of fashion and function by spotting trends before they go mainstream, enabling hyper-personalized shopping, and even co-designed collections mixing traditional sportswear and luxury. In 2025, activewear isn’t just what women wear to work out but it’s what they live in.
Sources: (Mintel) ; (Heuritech)
Customer experience is now as vital as the clothing itself. Brands build loyalty by blending technology, personalisation, and emotional connection, offering innovations like AI-driven recommendations, virtual try-ons, and community-driven insights. Consumers expect seamless, tailored journeys where trust, quality, and authenticity are paramount.
Consequently, the "best fit" is increasingly digital and emotional, not just physical. Leading sportswear brands, such as Nike and Lululemon, demonstrate this by harnessing AI and machine learning to deliver product suggestions and apparel explicitly tailored to individual preferences and precise fit.
Sources: (StoryStream) ; (Retail Technology Innovation Hub)
Lifestyle is the real trendsetter. Women aren’t just buying sportswear for workouts. They’re choosing pieces that reflect who they are and how they live. The demand for versatile, stylish, and comfortable clothing has blurred the lines between gym gear and everyday fashion, fueling the rise of luxury athleisure.
Whether it’s leggings at brunch or hoodies on a shopping run, activewear is now a uniform for modern, wellness-driven living. Brands are also responding to the need for eco-friendly materials by using technology to engineer sustainable materials that are durable, lightweight, yet soft and breathable.
As one of the fastest-growing segments in fashion, women’s activewear thrives on smart, high-impact promotions. Brands must go beyond basic ads by leveraging social media challenges, influencer partnerships, referral programs, and user-generated content to build awareness and loyalty. Campaigns like 30-day workout challenges or fitness-themed giveaways not only engage communities but also turn customers into brand ambassadors.
AI and machine learning are taking this further, enabling targeted ads that resonate with a consumer’s specific fitness goals and lifestyles. In this space, the best promotions aren’t just selling clothes. They’re fueling motivation, community, and connection.
Sources: (Photoshelter) ; (Opensend) ; (Digital Defynd)
Through listening247’s analysis of over 52,000 online conversations, it’s clear that the women's activewear market is thriving as it evolves from pure sportswear into a wellness lifestyle uniform. Future success is defined by the integration of AI and technology, which enables brands to deliver hyper-personalized products, compelling community experiences, and customer journeys where the "best fit" is emotional, digital, and physical.

.webp)
What do over 9,300 social media conversations on platforms like X, Instagram, and TikTok analysed by listening247 tell us about the grocery retail industry in 2025? It’s in the midst of transformation. Technology, sustainability, and evolving consumer habits are reshaping how we shop for groceries. This blog dives into the latest trends and how retailers are using AI and automation to meet the rising demand for convenience, personalisation, and seamless shopping.
Did you know? Online grocery shopping has jumped 56% since 2022, with 22% of consumers now using delivery or pickup services.
In 2025, convenience is king. Shoppers want quick, affordable, and easy ways to buy groceries online or offline. To keep up, grocery stores are turning to tech like AI and unified checkout systems to manage inventory and prevent stockouts, while delivery services via mobile apps allow for speed and convenience. This, in turn, gives grocery brands more data to personalise the online shopping experience.
Sources: (Drive Research)
More shoppers are thinking green. From reducing food waste to offering local and eco-friendly products, sustainability is a priority. Smart checkout systems help by adjusting prices to avoid waste and highlighting eco-products. In South Africa, 64% of consumers are willing to pay more for sustainable goods. This means retailers who make green options affordable and visible have a big opportunity to lead and win loyal customers who care about the planet.
Sources: (Extenda Retail); (KLA)
Many stores are turning to automation to lower costs and increase efficiency within their stores. Self-checkouts, mobile payment options, AI inventory tracking, and even cashierless stores make shopping faster and easier. Behind the scenes, these technologies also help reduce errors. Think smart shelves that track stock and AI to predict busy times so stores can staff smarter, or even autonomous stores that run almost by themselves. Automation is not just about convenience, it’s about efficiency.
Sources: (Extenda Retail); (Scale Computing)
Today’s shoppers are seeing shopping experiences tailored just for them. Using AI and data, grocery stores can create personalized deals, targeted ads, and in-store experiences that feel unique to each customer. Stores are using data collected to better identify their ideal customer profile and tailor stocked items or promotions for that group, turning data into meaningful connections. Personalization is no longer a bonus but expected by consumers.
Sources: (IGA); (Supermarket News)
.Shoppers want to move seamlessly between physical stores, websites, and apps. Retailers are building integrated systems powered by AI to deliver consistent, personalized experiences no matter where you shop. With 73% of consumers preferring multichannel shopping, stores that don’t connect their online and offline worlds risk losing customers. AI helps by analyzing data across all touchpoints, allowing real-time personalized service and smarter marketing. The challenge? Keeping data private and using AI ethically.
Sources: (Uniform Market); (Strategy Software); (Bridg)
AI is driving the changes behind these grocery retail shifts. It helps predict what customers want, manages stock efficiently, personalizes offers, and smooths out delivery logistics. In a world where budgets are tight and shopping habits shift fast, AI enables retailers to stay agile and relevant.
With over 1 in 5 shoppers now buying groceries online, AI makes sure the experience is seamless, cost-effective, and scalable, helping stores grow while meeting new consumer expectations.
By listening247 analysing over 9,300 social media conversations around grocery shopping trends, it’s clear that the 2025 grocery retail industry is defined by five big forces: online shopping, sustainability, automation, personalization, and omnichannel experiences. Consumers want more than products, they want convenience, value, and choices that reflect their values. To win, retailers must become data-driven and customer-focused, using AI and technology not just to keep up, but to lead. The future of grocery shopping isn’t just about shelves and checkouts but it’s about smart, seamless, and sustainable experiences that connect with shoppers on a whole new level.

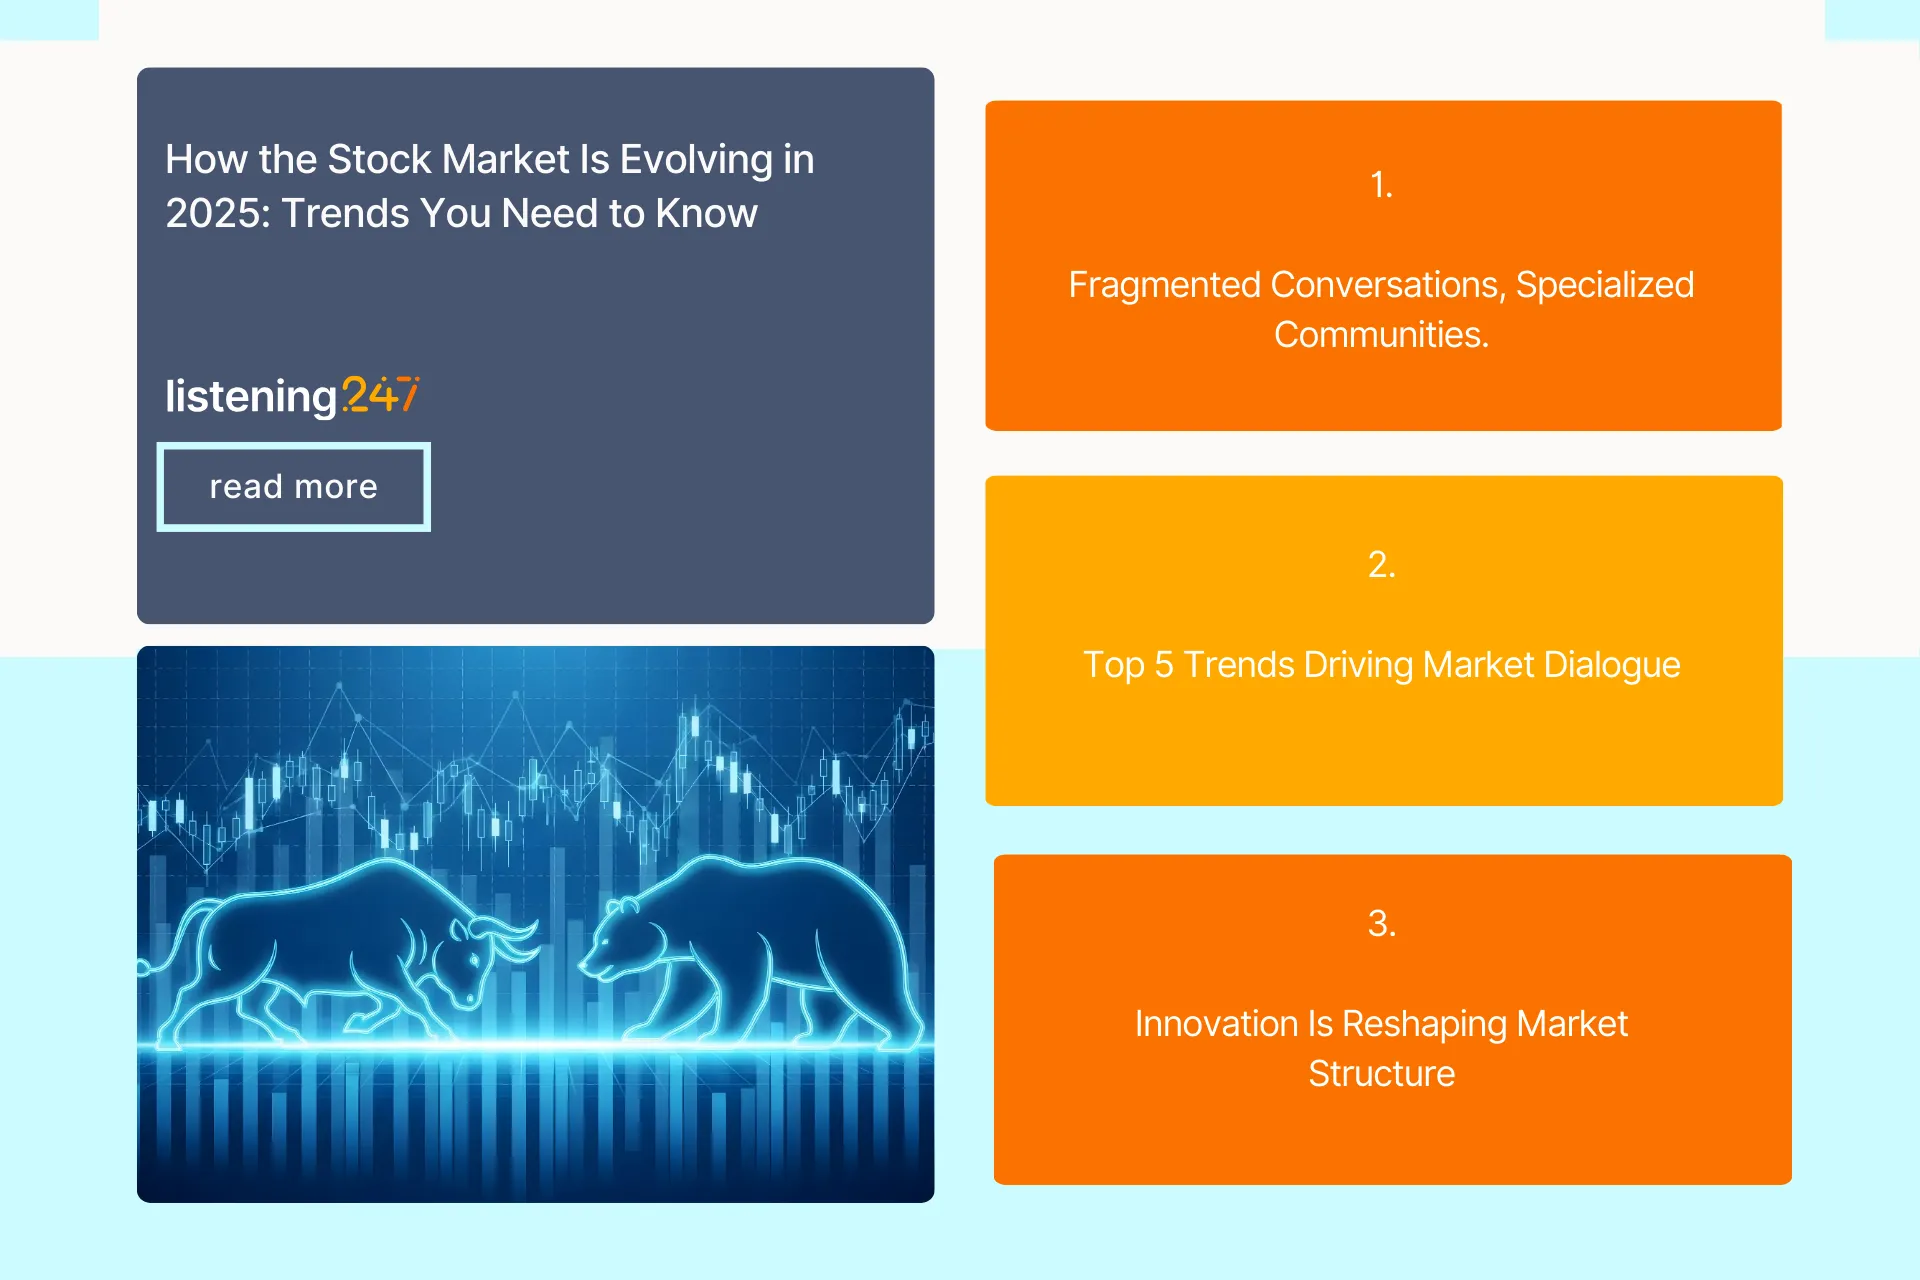
What do thousands of online conversations about the stock market reveal? The old way of doing things is gone. The market is no longer a single, unified place but a collection of specialized communities, each with its own interests. Company Fundamentals are no longer enough to discover alpha; alternative data (sentiment and buzz) from social media conversations are becoming an integral part of every hedge fund's investment strategy. To succeed, you have to know what matters to each one.
listening247 collected, processed, and analyzed over 200,000 social media conversations on X, Instagram, forums, and blogs and discovered the top (5) conversations leading the online discussions:
Surprisingly, Regulations and compliance (13,225 posts) and Technology and innovation (13,099 posts) were further down the list than expected.
Why is this valuable? The data reflects a growing fragmentation of the market's social dialogue which suggests distinct communities, each with its own set of concerns and interests. The stock exchange is evolving into a collection of interconnected but specialized markets, each with its own dedicated audience that should be monitored to ensure each niche is being recognized to ensure growth.
People are talking about new ways to invest as the securities exchange market is poised to grow by $56.67 billion by 2029. Things like digital assets and sustainable investments such as ESGs, are becoming a big deal. It's not just about getting a good return; it's about making a positive impact. But with innovation comes new risks. Market volatility is rising, pushing gold prices up and making debt more fragile.
Sources: (SA Reserve Bank); (technavio.com); (easyequities.co.za)
The trading market is faster and more accessible than ever. Automated trading and smart algorithms have made it easier for everyday investors to get involved. Growth stocks, small-caps, and ETFs are in the spotlight as investors look for strong returns. But being fast isn't enough. The key to success is having a long-term strategy and a diverse portfolio.
Sources: (Trading Bells); (The Recursive); (itbfx.com)
Listing a company on an exchange is no longer a local affair. With 62% of U.S. stock exchange listings now originating from foreign issuers, this shows the market is interested in deep liquidity and investor access through the NYSE. Geography now matters less than the value proposition an exchange offers.
New private markets, like London’s Pisces and Kenya’s micro-share trading, are also emerging, offering more ways for companies to raise money and a wider variety of options for investors.
Sources: (ey.com); (monkeyweek.com); (jse.co.za); (linklaters.com)
As everything moves online, a new community focused on security is growing and needed. Threats from hackers and sophisticated cybercriminals are on the rise exploiting weaknesses to advance geopolitical goals and challenge the security of stock exchanges.
This has led to an increased demand for stricter regulations, software security measures, and educating of consumers to better defend and keep financial systems safe.
Sources: (mofo.com) (jpmorgan.com)
Crypto is no longer on the outside looking in. Things like tokenized stocks offered by Kraken, have blurred the lines between crypto and traditional investing, making it possible to trade assets like Apple and Tesla 24/7 across borders. This enables a level of global participation and liquidity that legacy exchanges were never designed to handle leading to regulators, such as the SEC and CFTC, racing to build the scaffolding and infrastructure to blend the agility of crypto with the stability of traditional finance.
Sources: (reuteurs.com); (reuters.com); (forbes.com); (financeworld.io)
While the above five topics dominate the conversation, two other trends are quietly driving big changes. AI technology is now a core part of the market, helping to spot fraud and create personalized investment plans.
Looking ahead, AI will likely reshape the very architecture of stock exchanges. Expect to see AI-regulated trading platforms, smarter market surveillance systems to detect fraud and manipulation, and more personalized investment strategies driven by AI-powered robo-advisors. Exchanges may adopt AI to improve settlement efficiency, reduce systemic risk, and automate compliance. However, as AI grows more influential, regulators will face a tough balancing act: ensuring transparency, accountability, and fairness in a world where machines might understand the market better than we do.
The stock market of 2025 is a mix of traditional finance and new ideas, each with their own distinct communities and needs for continued growth and expansion. By reviewing over 200,000 posts, we see the market being reshaped by digital assets, faster trading, and a surge in cross-border listings. This evolving landscape blends traditional finance with innovation and global connectivity, while creating new opportunities and challenges for investors and regulators alike.
To succeed in this new landscape, it's essential to not only understand the broad trends but also actively listen to and engage with the unique concerns of each specific community, transforming challenges into opportunities.
According to research by Forrester, 53% of companies worldwide have a dedicated CX department, while the remaining companies may integrate CX responsibilities into other departments, such as marketing or operations, or may not have a CX function at all. In some cases, customer care or customer service may be the only CX related function, but this setup often falls short of the lofty goals of optimizing the overall customer experience.
Customer experience (CX) and insights are both critical components of understanding and improving customer satisfaction. While they may be closely related, they are distinct disciplines that require different approaches and skill sets. Therefore, it's essential to have clarity about the ownership and responsibilities of these functions, particularly when it comes to measuring customer experience with NPS trackers and by analysing customer calls and messages.
CX is about creating and delivering an exceptional experience for the customer throughout their journey with the company. CX teams focus on understanding customer needs, pain points, and behaviours to design and optimise the customer journey. They collect and analyse data from various sources, such as surveys, customer feedback via contact centres, and predictive analytics, to identify areas of improvement and create strategies to enhance the customer experience.
CXM – a popular acronym used in this context - stands for customer experience measurement or customer experience management. When it comes to the latter there is no doubt that the CX team is responsible for it. When it comes to measuring though the Insights team is well positioned to offer support or even own it.
Customer Experience (CX) teams are primarily focused on identifying actionable insights at the individual customer level. They typically rank customer pain points based on their frequency of occurrence and then identify both proactive and reactive solutions to address them.
On the other hand, insights teams are responsible for gathering and analysing data to generate insights that can drive business decisions. Insights teams use a wide range of data sources, including customer data, market research, and internal business data to identify trends and patterns, support new product development, monitor business performance, and generally inform decision-making.
Insights teams are primarily focused on discovering strategic insights that are actionable at the total market level, rather than the individual customer level.
The process of discovering a true market insight is not straightforward. It requires multiple sources of data to be integrated, an actionable hypothesis supported by synthesised data, and a little intuition and gut feeling.
When it comes to NPS trackers, the lines between CX and insights can get blurred. NPS (Net Promoter Score) is a widely used metric for measuring customer loyalty and satisfaction. It involves asking customers how likely they are to recommend the company to others, on a scale of 0 to 10. The NPS score is calculated by subtracting the percentage of detractors (0-6) from the percentage of promoters (9-10) while ignoring the passives (7 & 8). The score provides a benchmark for how well the company is meeting customer needs and expectations.
Both CX and insights teams can benefit from NPS data. CX teams can use the score to understand how customers perceive the company and its products/services and identify areas for improvement in the customer journey. Insights teams can use the data to track overall customer satisfaction and loyalty, compare the company's performance against competitors, and identify factors that influence customer behaviour.
So, who should own the NPS tracker if CX is a separate department? The answer may vary depending on the company's size, structure, and culture. In some cases, CX and insights functions may be combined, and one team may be responsible for both functions. In other cases, the teams may be separate, and the ownership of the NPS tracker may depend on the purpose and goals of the survey or simply where the budget sits.
CX teams, if they have the skillset, could take the lead in designing and implementing NPS surveys since they are more closely related to the customer experience. Dedicated CX teams should have the expertise and experience to design surveys that capture customer feedback effectively, analyse the results, and translate them into actionable insights for the business.
However, insights teams can also play a crucial role in analysing and interpreting NPS data. Insights teams have a broader perspective on the business and can provide valuable insights into how customer satisfaction and loyalty relate to other business metrics. Insights teams can also identify trends and patterns in the data that can inform strategic decisions.
At listening247 we published a lot of articles on the importance of not just relying on a sample of customers who agree to take a survey but listening to all customer interactions using AI for natural language processing.
Ultimately, the success of a company's CX and insights functions depends on collaboration and communication between the teams. Both functions are essential for understanding and improving the customer experience, and both have a role to play in measuring customer satisfaction with NPS trackers. The roles of the two functions have to be well defined to avoid confusion and misunderstandings.
By working together, CX and insights teams can ensure that the NPS data integrated with all the other customer interactions tagged with sentiment (such as phone calls, chats, emails etc.) are used effectively to drive business decisions that benefit both the customer and the company.

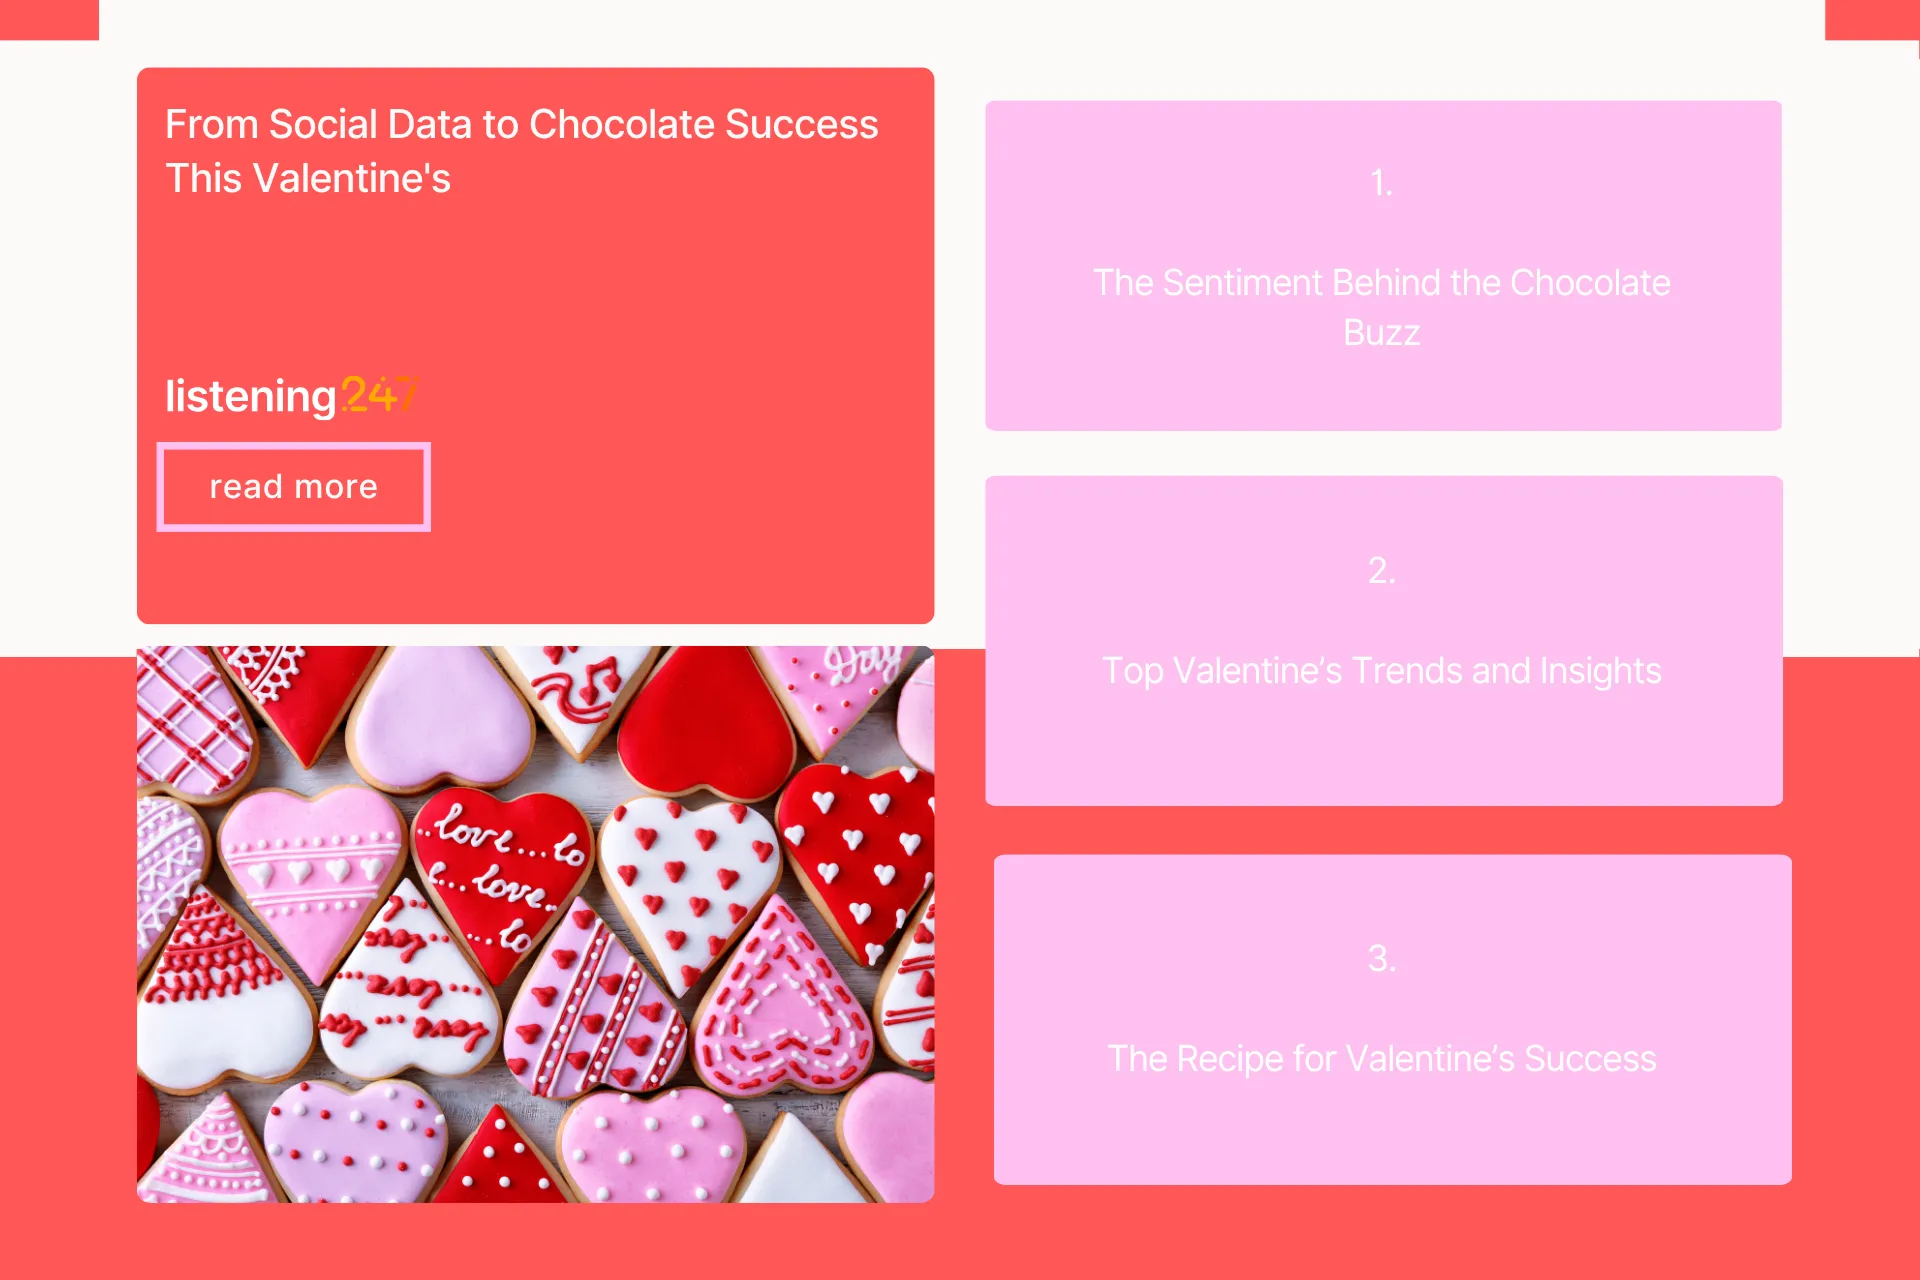
With Valentine’s Day on the horizon, the chocolate industry is in full swing to make their mark and drive sales and brand engagement. Using listening247’s Social Listening and Analytics, we analysed 24,930 posts from Instagram across multiple regions and languages, including English, Italian, Korean, and Indonesian. Our goal? To uncover the most influential conversation drivers around chocolate, love, and seasonal promotions.
Among the posts analysed:
If there’s one thing chocolate lovers adore more than indulging, it’s winning free chocolate. Giveaway promotions dominated the conversation, accounting for 14,884 of the total posts analysed. Brands like That’s It and Choczero sparked engagement through interactive contests, encouraging users to tag, share, and follow for a chance to win exclusive treats. Lindt and Baci Perugina took things further, tying their giveaways to limited-edition Valentine’s chocolates, ensuring their brand stayed top-of-mind as shoppers browsed for the perfect gift.
Takeaway: Giveaways don’t just create buzz; they build brand affinity and amplify visibility across social media. Tying contests to seasonal events maximises impact.
Valentine’s Day isn’t the only reason people talk about chocolate; seasonal occasions accounted for 6,085 posts, reinforcing how deeply chocolate is woven into celebrations. Brands like Lindt and Baci Perugina successfully capitalised on holiday excitement with heart-shaped boxes, themed promotions, and limited-edition releases.
Beyond promotions, people are passionate about their chocolate preferences. 3,801 posts discussed chocolate types, from dark and milk varieties to unique flavours. Discussions on discontinued favourites like mango and cream truffles gained traction, highlighting opportunities for brands to reintroduce nostalgic flavours.
Takeaway: Nostalgia sells. Revisiting past favourites or launching limited-edition throwback collections can rekindle consumer excitement.
Valentine’s Day-specific promotions accounted for 807 posts, with Lindt’s Pick & Mix selections and Baci’s signature love-note chocolates standing out. While consumers embraced these festive offerings, some concerns emerged around pricing. A Valentine’s loyalty programme could be a strategic move to balance premium appeal with affordability.
Takeaway: Limited editions fuel demand, but pricing strategies should ensure accessibility without compromising brand value.
With 493 posts, chocolate emerged as more than just a treat; it’s a symbol of affection. Baci Perugina’s multilingual “Love Note” campaign was a standout, adding a personal touch that deepened emotional connections. Lindt’s Pink Mixed Bar Bouquet and Lindor chocolates, often paired with roses, reinforced the role of chocolate in heartfelt gifting.
Takeaway: Thoughtful packaging and personalised messaging enhance emotional appeal and gift desirability.
Although less frequently mentioned, events and gifting traditions made their mark, with 275 posts discussing chocolate’s role in group celebrations and gifting culture. The Valentine’s Chocolate and Wine Walk was a particular highlight, proving that immersive brand experiences leave a lasting impression.
Takeaway: Experiential marketing, such as chocolate pairing events, can deepen consumer engagement beyond traditional advertising.
Valentine’s Day remains a key moment for chocolate brands.The top-performing strategies? Giveaways for engagement, personalised packaging for emotional appeal, and nostalgia-driven product revival to spark consumer excitement. Brands like That’s It, Lindt, and Baci Perugina demonstrated how interactive campaigns and thoughtful promotions can turn seasonal shoppers into lifelong customers.
As brands prepare for the next big occasion, one thing is clear: chocolate is more than just a treat; it’s a storytelling tool, a memory-maker, and the ultimate symbol of indulgence and love.

As 2025 approaches, the cryptocurrency industry is ready for change. The rapid evolution of blockchain technology, institutional interest, and emerging trends like Real-World Asset (RWA) tokenisation are reshaping the market. At the same time, challenges like financial crime and regulatory uncertainty demand robust strategies for navigating this complex environment.
Using listening247’s Social Listening and Analytics, we analysed over 31,976 posts collected from diverse sources, including X, TikTok, Instagram, blogs, boards, reviews, and news outlets between 29th February 2024 and 8th January 2025. By diving deep into this data, we uncovered key trends and conversation drivers highlighting opportunities and risks for investors in the cryptocurrency ecosystem.
Out of the total posts analysed:
The rising popularity of digital currencies such as Bitcoin and Ethereum has sparked significant discussion, with 17,222 posts highlighting their adoption in developed countries. Key drivers of this trend include the ease and flexibility these currencies offer in transactions, making them increasingly appealing to investors worldwide. Central Bank Digital Currencies (CBDCs) are also gaining momentum, with institutions like the Bank of Thailand and the People's Bank of China leading the charge.
This trend represents an opportunity for e-commerce or online retailers to integrate cryptocurrency payment solutions, offering customers flexibility and staying ahead in the evolving digital economy.
Our analysis revealed that discussions about cryptocurrency prices dominated the conversation, accounting for 13,893 of the 31,976 analysed posts. These discussions centred on key factors influencing valuations, such as supply-demand dynamics, market capitalisation, and external drivers like social media trends and government regulations.
Companies in financial services, investment platforms, and FinTech can benefit significantly by offering real-time price tracking tools and predictive analytics that help users make data-driven decisions.
Financial crime risks in the cryptocurrency industry are a significant and growing concern, as revealed by the analysis of 13,061 posts across various platforms. Our findings indicate that while the rise of Decentralised Finance (DeFi) has sparked innovative financial models and reshaped the industry, it has also opened the door to increasingly sophisticated cybercrimes.
Businesses in the crypto space must prioritise compliance, adopt advanced monitoring tools, and educate users on safeguarding their assets. Blockchain analysis tools are essential for tracing illegitimate fund flows and maintaining trust in the ecosystem.
The growing interest is in tokenised assets, evidenced by 7,436 posts, highlighting the increasing convergence of traditional finance and blockchain innovation.
This trend signals opportunities for financial institutions to develop tokenised financial products, offering new revenue streams and appealing to tech-savvy investors.
Non-Fungible Tokens (NFTs) are a hot topic with 4,847 posts analysed, highlighting their enduring appeal and relevance. However, the findings reveal significant challenges within the market, including concerns around fraud, money laundering, and the lack of clear regulatory frameworks.
Businesses and investors in the NFT space must advocate for stronger compliance measures and transparent practices to build trust and ensure long-term viability.
The cryptocurrency market is at a crossroads, offering immense opportunities alongside challenges. Insights from listening247's Social Listening and Analytics can benefit:
Whether it's understanding consumer sentiment, identifying emerging trends, or mitigating risks, listening247 equips you with the actionable intelligence needed to succeed in the evolving world of crypto.

.webp)
The festive season is upon us, and Christmas 2024 promises a celebration that blends cherished traditions with fresh, modern interpretations. Using listening247’s Social Listening and Analytics, we analysed over 50,117 posts from Twitter, TikTok, and Instagram between 5th October and 8th December. Keywords such as Christmas Gifts, Secret Santa, Christmas 2024, Holiday Season 2024, Gift Ideas, Holiday Shopping, Christmas Shopping, Festive Gifts, and Holiday Gifts were used to categorise posts.
These posts shed light on the key conversation drivers and trends that brands can leverage to create unforgettable holiday experiences.
Holiday cheer dominates online discussions, with a significant 68% (34,358 posts) expressing positive sentiment. Neutral conversations accounted for 29% (14,384 posts), while negative posts were low at 3% (1,375 posts). This overwhelming positivity prompts brands to connect with customers through festive messaging.
With 36,816 mentions, occasions emerged as the leading theme this holiday season. Consumers prefer shared experiences over material gifts, marking a cultural shift towards valuing time spent with loved ones.
This trend highlights the importance of framing campaigns around moments that matter for brands. Think event-driven promotions, experiential pop-ups, or even hosting holiday workshops to tap into the emotional core of Christmas. By aligning products and services with these experiences, brands can foster a deeper connection with their audience.
The allure of winter wonderlands - complete with sparkling lights, frosty landscapes, and cosy settings - is pulling audiences. This theme reflects a universal desire for escapism, nostalgia, and the joy of immersive holiday environments.
Brands can capitalise on this by transforming store displays into magical winter settings or curating themed collections inspired by the festive season. Even digital spaces can incorporate "winter wonderland" shopping experiences using AR-powered (augmented reality) winter effects.
Christmas carols with traditional melodies are being offered in interactive formats like virtual sing-alongs, community carol events, and life performances. Carols act as a unifying force, bringing families and communities together during the holidays.
Brands can harness this trend by sponsoring carolling events, incorporating carol-themed marketing campaigns, or creating playlists to complement the shopping experience.
In 2024, exceptional customer experiences are the ultimate differentiator. Shoppers seek seamless, personalised interactions at every touchpoint, from festive packaging to in-store ambience and online convenience.
This was never about selling products but building an emotional connection with the customer. Brands should focus on creating memorable experiences, such as personalised gifting services, festive loyalty rewards, or interactive in-store events that leave a lasting impression.
Sustainability continues to shape consumer behaviour. From eco-friendly holiday decor to gifts with purpose, shoppers are drawn to brands that reflect their values. Many are engaging in charitable giving, seeking ways to give back through donations and community drives.
Brands can respond by offering sustainable products, recyclable packaging, and charity collaborations. Highlighting eco-conscious initiatives in holiday campaigns resonates with consumers and strengthens brand loyalty.
The season is no longer confined to a single location. Many are opting for unique travel experiences, whether snow-covered retreats or tropical getaways. At its heart, this trend revolves around the desire to connect with loved ones, bridging geographical gaps to create cherished memories.
This opens up opportunities for brands to market travel-friendly products, such as compact gifts, travel kits, or digital gifting options. Partnering with travel companies or creating holiday content tailored to travelling audiences can further amplify relevance.
Christmas 2024 is a season of connection, creativity and purpose. Consumers are looking for experiences that resonate emotionally, whether through the carols, the escapism of winter wonderlands, or the shared joy of meaningful occasions.
The message is clear for brands: adapt to these evolving preferences by focusing on experiences, sustainability, and personalisation. With data-driven decisions, brands can create memorable and meaningful campaigns - ensuring Christmas 2024 is one to remember for customers and brands alike.

.webp)
As Black Friday 2024 draws closer, retailers worldwide are gearing up for one of the busiest shopping days of the year. With billions spent in a single day, it’s an unmissable opportunity to connect with consumers, boost sales, and build brand loyalty. Thanks to listening247’s Social Listening and Analytics, we’ve uncovered the key trends and conversation drivers shaping this year’s Black Friday, helping retailers align with consumer behaviour and stand out in a crowded market.
Over 15,719 social media posts in English from platforms like Twitter, TikTok, and Instagram between 20 September and 15 November were analysed, to provide a wealth of data on what shoppers are saying, what they want, and how they feel about Black Friday 2024. Keywords such as Black Friday, Black Friday 2024, online shopping, in-store shopping, gift shopping, and Christmas shopping were used to track and categorise posts.
The buzz around Black Friday remains overwhelmingly positive:
Shoppers are excited, and motivated by the promise of unbeatable deals and the chance to save on holiday purchases. Positive sentiment is around tech deals, personalised promotions, and early access discounts, while negative sentiment is minimal, often tied to delivery delays or website crashes.
Using listening247, we identified the dominant topics shaping consumer conversations:
1. Technology – 12,881 posts: Tech products remain the crown jewel of Black Friday, accounting for nearly half of purchases. Televisions, laptops, gaming consoles, and smartwatches are the most wanted items. Major retailers like Amazon and Best Buy are expected to lead the charge with deep discounts, making this a key category for shoppers and brands.
2. Price – 9,313 posts: Pricing is a decisive factor in consumer decision-making. With financial pressures rising, shoppers are thoroughly comparing deals, looking for the best value, and waiting for Black Friday to make high-ticket purchases.
3. Discount Deal Promotions – 9,224 posts: Shoppers are actively seeking pre-Black Friday sales and exclusive member rewards. Brands offering early access or time-limited offers are seeing increased engagement, highlighting the effectiveness of targeted, exclusive promotions.
4. Gift Ideas – 7,116 posts: Black Friday is a prime moment for gift shopping. Consumers are turning to curated gift guides and social media for inspiration, with jewellery, apparel, and tech products topping the list of preferred gifts.
5. Shopping Platform – 2,094 posts: More than half of shoppers prefer online platforms to avoid crowds and enjoy convenience. Social media-driven e-commerce is particularly popular with Gen Z and Millennials, who rely on mobile-first shopping experiences.
1. Tech-Takeover: Electronics are projected to dominate Black Friday spending, driven by promotions from retailers like Walmart and Target. Smart home devices, gaming consoles, and high-end TVs are leading the wish lists. The influence of younger shoppers, particularly Gen Z and Millennials, is steering purchases online, where seamless digital experiences win the day.
2. The Power of Price: Pricing remains king. Consumers have set aside budgets specifically for Black Friday, emphasising its role as a cornerstone shopping event. The focus isn’t just on discounts but on true value, with shoppers scrutinising every deal to ensure it’s worth the spend.
3. Discount-Driven Decisions: Early-bird promotions and tiered discounts are becoming standard. Successful brands are going beyond basic sales by offering “spend-and-earn” rewards or bundling discounts to entice shoppers. This maximises short-term revenue and builds customer loyalty for future events.
4. Gifts Variety: Black Friday is the ultimate inspiration hub for gift-givers. Retailers curating well-targeted gift guides see higher engagement and conversions, as consumers look for meaningful yet budget-friendly options.
Black Friday 2024 provides a golden opportunity for retailers to connect with their audience through strategic pricing, tailored promotions, and a strong digital presence. Here’s how to capitalise on these insights:
Black Friday 2024 is more than just a sales event—it’s a cultural moment that reflects shifting consumer priorities and behaviours. By understanding what shoppers want, why they’re excited, and how they plan to spend, brands can tailor their strategies to exceed expectations. Thanks to listening247’s powerful analytics, retailers have the insights they need to navigate this high-stakes season and come out on top.
Let’s make this Black Friday a win for your business and your customers.

.webp)
As the countdown to Halloween 2024 begins, it’s clear that this year’s celebrations are set to echo a blend of nostalgia and innovation, thanks to insights from listening247’s Social Listening and Analytics. Over 25,727 social media posts across Twitter, TikTok, and Instagram have been meticulously analysed to reveal what costumes will dominate and the sentiments surrounding this spooky season.
Our data reveals a robust positivity surrounding Halloween, with a striking 71% of posts radiating enthusiasm. Here’s a snapshot of the sentiment breakdown:
• Positive Sentiments: 18,336 posts (71%)
• Negative Sentiments: 1,589 posts (6%)
• Neutral Sentiments: 5,802 posts (23%)
This positivity is largely driven by families looking forward to trick-or-treating—a time-honoured tradition that promises joy and a bounty of memories for parents and their children.
Our analysis has pinpointed several key costume trends, shaped by discussions on purchase intentions, celebratory occasions, and peer recommendations:
1. Sexy Costumes: Embracing boldness and body positivity, sexy costumes are trending as symbols of empowerment. This trend highlights a shift towards costumes that celebrate individuality and self-confidence.
2. Nostalgic Revivals: A wave of nostalgia is bringing back favourites from the '80s and '90s. Expect to see a resurgence of characters from cult classics like “Beetlejuice,” alongside beloved Disney icons such as Mickey Mouse and Cinderella, tapping into the hearts of both new and lifelong fans.
3. Budget-Friendly Finds: Economic uncertainties have steered the trend towards cost-effective costumes. With a spike in searches for “budget-friendly costumes,” it's clear that affordability is top of mind for many this season.
4. Musical Homages: From rock legends like Freddie Mercury to pop sensations like Madonna, and current stars like Sabrina Carpenter, costumes inspired by musical icons are allowing fans to embody their favourite artists.
5. Couples Costumes: Doubling the fun, couples are choosing to coordinate their outfits, showcasing their relationships through creative and complementary ensembles.
6. Eco-Conscious Choices: Reflecting a growing dedication to sustainability, there’s an increased interest in eco-friendly costumes and decorations made from recyclable or biodegradable materials.
The capability of listening247 to drill down into the specifics of social media chatter has not only revealed what people will be wearing but also why certain trends are taking hold. For instance, the popularity of sexy costumes correlates with a broader cultural movement towards embracing body positivity and self-expression.
Moreover, the detailed sentiment analysis provides brands with a clear understanding of consumer attitudes towards Halloween, empowering them to align their marketing strategies with real-world preferences and expectations.
As brands look to capitalise on Halloween, the insights provided by listening247’s Social Listening and Analytics offer a strategic advantage by unpacking the complexities of consumer behaviour and trending topics.
This Halloween, equipped with data-driven insights, brands are better positioned to meet consumer desires head-on, ensuring a celebration that’s as delightful as it is insightful.

.webp)
Just like every other buzzword, it means different things to different people. Is there a simple definition of AI that everyone can understand? You bet! AI can be classified as weak or strong AI.Weak AIThe majority of current AI use cases - such as social intelligence using text analytics (NLP) - fall under weak AI. It usually involves supervised machine learning, though we are increasingly seeing use cases where semi- or unsupervised machine learning is being used. For the time being, let’s define (weak) AI with this simple formula:
Strong AI
Strong, full or general AI is something different. For most people it is defined by Alan Turing’s test whereby according to Wikipedia “A machine and a human both converse sight unseen with a second human, who must evaluate which of the two is the machine, which passes the test if it can fool the evaluator a significant fraction of the time”. The optimists among pundits claim it will be with us in 10-15 years from now, the pessimists say by 2100.
Some people talk about machines with consciousness. To paraphrase the well known author Yuval Noah Harari: a taxi driver needs to only take us from A to B, we are not interested in how he feels about the latest Trump news or the sunset; thus an autonomous car has a good enough AI to do the job without needing to feel or having a consciousness. The same applies to so many other aspects of work and life. Will machines ever be able to feel? Is that necessary for strong Ai to exist?
AI’s impact on humanity
“Two billion people will be unemployed by 2050.”
“Humanity is in danger of being taken over by machines”
“This could spell the end of the human race” said the late Stephen Hawking. Elon Musk and Bill Gates are also often quoted expressing a similar opinion. The flipside of the coin is that humanity should choose to see a positive version of the future, and then strive to make it happen. Rather than worrying about unemployment, we should be looking forward to spending more time on the beach, pursuing our passions and hobbies to perfection. I dream of days philosophising in a circle of close friends (also fellow philosophers) about the meaning of life… and not just human life as this has been covered by Plato, Aristotle and others; maybe we will be focussing on the lives of robots who can fall in love, or superhumans with chips in their brains that are “a-mortal” - as opposed to immortal (stuff for another blog post).
Doing market research using AI is a close second to philosophising.
Universal Basic Income (UBI)
The best idea floating around when it comes to managing unemployment brought on by the impact of AI is the UBI. Having said that, being the best idea so far does not necessarily make it a great idea. Too many people with some means and lots of time on their hands may ultimately become a curse for humanity. Possible outcomes include:
Artificial intelligence for text and image analytics has been around for years, and listening247 has been carrying out R&D for the social intelligence use case since 2012. Strangely, we haven’t yet published our view on the impact that AI will have on humanity in the near to medium term future. It is time to rectify this!
We need new laws and we need to figure out what moral compass we want to ingrain in the autonomous machines of the future - if that is at all possible.
We want to ideally avoid scenarios described in science fiction films such as Ex Machina and I, Robot.
As per Isaac Asimov’s laws about robots from the previous century:
• A robot may not injure a human being or, through inaction, allow a human being to come to harm.
• A robot must obey the orders given to it by human beings, except where such orders would conflict with the First Law.
• A robot must protect its own existence as long as such protection does not conflict with the First or Second Laws.
At a first glance they seem reasonable; he certainly thought that if these principles were to be applied, humanity would be safe from destruction by AI powered machines.
Apparently he is wrong.
What we will need is machine ethics for super-intelligence, and the laws or principles cannot be chauvinistic as Asimov’s are. Humans cannot realistically expect to be the boss of machines that are a million times smarter than them.
Ray Kurzweil the author of ‘The Singularity Is Near: When Humans Transcend Biology’ predicts that the singularity moment will happen around 2045. Ray said in his book:
“I regard someone who understands the Singularity and who has reflected on its implications for his or her own life as a ‘singularitarian’.”
I guess thinking about and writing this article - I will not claim I understand the Singularity - may make me a singularitarian! What do you think?
There is an impressive and humbling definition of this moment that I heard from a fellow YPO member, who among other things is the Executive Director of Singularity University Germany, Nikolaus Weil, at a CEO (organisation) recruitment event:
I will paraphrase but the gist is: “It is the moment in time at which machines will acquire the same knowledge and capability as the whole of humanity and in the next 5 minutes by continually improving themselves will become millions of times smarter than humans”.
AI = Augmented Intelligence
Some people like to challenge the notion of artificial intelligence so they decided to give the acronym AI a new interpretation namely “Augmented Intelligence”.
Vernor Vinge came up with these 4 options of the singularity manifestation:
The development of computers that are "awake" and superhumanly intelligent.Large computer networks (and their associated users) may "wake up" as a superhumanly intelligent entity.Computer/human interfaces may become so intimate that users may reasonably be considered superhumanly intelligent.Biological science may find ways to improve upon the natural human intellect.[9]
Options 3 and 4 may involve the augmentation of human intelligence to a superintelligence.
The problem with these two options is that only super rich people will be able to afford them; thus ending up with some serious inequality issues between new castes or should we say new breeds of humans.
I think this article is running away from me. It feels like one thing leads to another, one thought to the next; there is no end and I feel like getting a beer,so I will end it - abruptly - here.
My fitbit is asking me to start preparing to go to bed … futurism is a very tiresome business!


In an increasingly digital world, social media platforms have transformed the way individuals connect, share information, and express opinions. Banks can leverage the power of social media listening to manage loan default risks effectively. By gathering and analysing online posts about the companies to which they have extended loans, banks can conduct continuous commercial due diligence and identify early warning signals when debtors encounter financial difficulties. This post explores how banks can utilize social media listening as a strategic tool to proactively manage loan default risks and enhance their risk management practices.
Social Listening & Analytics involves monitoring and analysing online conversations, mentions, comments, and reviews across various social media platforms. It allows banks to extract valuable insights and gain real-time information about the financial health, market reputation, and business activities of the companies they have extended loans to. By employing machine learning for natural language processing techniques, banks can effectively identify potential red flags indicating financial difficulties and anticipate loan defaults.
A. Proactive Risk Assessment:
Traditional due diligence processes primarily focus on pre-loan assessment, often failing to capture evolving risks that borrowers may face after obtaining the loan. By incorporating social media listening into their risk management framework, banks can conduct continuous commercial monitoring in addition to their due diligence during the loan underwriting or credit extension phase. This enables them to monitor ongoing developments, industry trends, and financial indicators related to their borrowers, providing a more comprehensive risk assessment. These non-traditional indicators of credit quality and borrower’s abilities to service their debts and obligations give a much fuller picture than simple financial statements which are backward looking and often don’t provide the full story. This alternative data can also be a better predictor of borrower behaviour than historical financial statements.
B. Real-Time Insights:
Social media platforms act as virtual marketplaces where individuals freely share their experiences, opinions, and concerns. By monitoring online posts about borrower companies, banks can gain real-time insights into their operations, financial stability, customer sentiment, and market perception. Any notable shifts, negative sentiments, or concerning patterns identified through social media listening can serve as red flags, prompting banks to investigate further and take necessary actions. As we have seen recently with the collapse of Silicon Valley Bank and First Republic Bank in the US, depositor sentiment played a striking role in their demise. Due to adverse online sentiment that spread very rapidly, customers and depositors caused a digital run on the bank that had never been seen or experienced before. In the case of Silicon Valley Bank, deposits were leaving at the rate of $1 million per second for 10 hours (or $41 billion).
A. Detecting Financial Difficulties:
Social media listening allows banks to identify early warning signals of potential financial difficulties faced by their borrowers. By analysing online conversations, comments, and reviews, banks can detect signs of operational challenges, supply chain disruptions, declining customer satisfaction, or negative market perception. These signals can help banks proactively engage with borrowers, assess their financial health, and take appropriate measures to prevent loan defaults.
B. Amplifying Existing Risk Indicators:
Social media listening augments traditional risk indicators with additional insights derived from user-generated content. For example, a decline in positive sentiment towards a borrower company may coincide with a decrease in revenue, an increase in customer complaints, or a deteriorating market position. By integrating social media listening into their risk management framework, banks can enhance their ability to identify and act upon early warning signals, thereby mitigating loan default risks.
“Effective Early Warning Systems (EWS) reduce loan loss provisions by 10%-20% and required regulatory capital by 10%”
Galytix paper in association with PWC
A. Leveraging Advanced Tools:
To effectively analyse vast amounts of online data, banks can employ machine learning and sentiment analysis tools. These tools enable banks to filter and categorize information, identify patterns and trends, and extract meaningful insights. By leveraging sentiment analysis, banks can assess the overall market sentiment towards borrowers and gauge the impact of external factors on their financial health.
B. Enhancing Risk Models:
Integrating social media listening insights into risk models can strengthen banks' loan default risk assessments. By combining traditional financial indicators with sentiment analysis and social media data, banks can improve the accuracy and predictive power of their risk models. This holistic approach allows for a more comprehensive evaluation of borrower creditworthiness and provides a deeper understanding of the potential risks associated with loan defaults.
A. Privacy and Data Protection:
As banks engage in social media listening, it is crucial to prioritize data privacy and protection. Banks must ensure compliance with relevant data protection regulations and implement robust security measures to safeguard the information collected. Respecting user privacy, obtaining consent, and anonymizing data if necessary are essential steps to maintain ethical practices. This is of particular importance when used for due diligence and for the monitoring of individuals and their transactions, as is required of banks by Know-Your-Customer rules and regulations imposed upon them by the authorities.
B. Noise and Information Overload:
The sheer volume of online information can pose challenges in effectively filtering and interpreting relevant data. Banks can employ sophisticated filtering techniques and analytical tools to address information overload. Machine learning algorithms and natural language processing can help identify key topics or themes, prioritize relevant content, and provide actionable insights to manage loan default risks efficiently.
By harnessing the power of social media listening, banks can conduct continuous commercial due diligence and effectively manage loan default risks. Monitoring online posts about borrower companies enables banks to gather real-time information, detect early warning signals, and anticipate financial difficulties. However, banks must navigate ethical considerations, prioritize data privacy, and address information overload challenges. When implemented strategically, social media listening empowers banks to proactively manage loan default risks, enhance risk management practices, and ensure more informed lending decisions.
“Banks that fail to improve their EWS will also face significant regulatory pressures. The European Central Bank (ECB) has highlighted the huge variation in the quality of early warning systems and how credit assessment at a micro as well as macro level is core to risk management and processing.”
Galytix paper in association with PWC.
.webp)
In a recent advertising blunder, Apple has faced significant backlash over its latest iPad Pro ad, which many have criticised as a ‘destruction of the human experience’. This controversial advertisement depicted the crushing of musical instruments and books, symbols of culture and creativity, drawing anger from consumers and sparking an online uproar.
The role of social media in amplifying consumer opinions cannot be underestimated. When Apple’s ad was posted on CEO Tim Cook’s X (formerly Twitter) account and YouTube, the negative response was swift and widespread. Comments flooded in, condemning the ad for being tone-deaf and disrespectful to the arts. This overwhelming backlash led to Apple quickly pulling the advertisement from all paid media channels.
This incident highlights the immense power of unsolicited consumer opinions on social media. Unlike traditional feedback mechanisms, social media allows consumers to express their views instantly and publicly, creating a significant impact on brand perception. The ad’s rapid spread and the ensuing negative sentiment demonstrate how crucial it is for brands to monitor and understand these conversations in real time.

In situations like this we use listening247 to decode consumer sentiments. listening247’s accuracy enables us to dissect online conversations with surgical precision, providing invaluable insights into the ever-shifting landscape of consumer preferences. In light of the recent controversy, we delved into the depths of digital discourse to uncover the true extent of the backlash against Apple's brand.
Utilising listening247’s Trend Discovery solution, we scoured social media platforms, forums, blogs and news articles to gauge the prevailing sentiment surrounding Apple's controversial ad. What emerged was a complex tapestry of opinions, ranging strong critics of ad for being insensitive and disrespectful to cultural symbols like musical instruments and books to being disgusting and destroying the art and society in general.

In the realm of marketing, perception is paramount, and the fallout from this ad controversy threatens to tarnish Apple's carefully cultivated image as a purveyor of innovation and human-centric design. The listening247 social listening and analytics solution reveals a notable shift in consumer sentiment, with a significant uptick in negative perceptions towards Apple in the wake of the ad's release.
Apple’s misstep underscores the importance of staying in tune with consumer sentiments and the cultural context of advertisements. It serves as a stark reminder for businesses to not solely rely on gut feelings but to incorporate data-driven insights into their decision-making processes.
The Apple iPad Pro ad controversy serves as a potent reminder of the importance of listening to consumer voices and the power of social media. By leveraging advanced social listening and analytics solutions like listening247, brands can avoid similar pitfalls, make informed decisions, and maintain a positive brand image. In today’s dynamic market, staying connected to consumer sentiments is not just beneficial—it’s essential for sustained success and growth.
Stay ahead of the curve with listening247, and ensure your brand is always in tune with the voices that matter most—your customers.


In today's fiercely competitive business landscape, companies are constantly seeking ways to gain an edge over their rivals. Among the various capabilities that contribute to success, unstructured data analytics capability stands out as indispensable for survival in the face of intense competition. This post explores the significance of text and image analytics specifically and argues that no company can thrive without harnessing the power of these capabilities. There is of course also audio and video analytics to consider but once the tech is available to analyse text and images the rest can be handled with voice-to-text and image-to-text technology. More details on this below.
1. Uncovering Insights: Text and image analytics enable companies to extract valuable insights from vast amounts of textual and visual data. By employing sophisticated algorithms and machine learning techniques, businesses can analyse customer feedback, reviews, social media posts, and other textual data sources. This allows them to identify emerging trends, preferences, and sentiment patterns, leading to informed decision-making and strategic planning. Similarly, image analytics empowers companies to understand visual content, enabling them to recognize brand logos, product placements, and consumer behaviour from images shared on social media platforms. The ability to uncover such insights provides a competitive advantage by allowing businesses to stay ahead of the curve.
2. Enhancing Customer Experience (CX): Text and image analytics play a crucial role in enhancing the customer experience, which is a key differentiator in today's market. By leveraging these capabilities, companies can gain a deep understanding of customer needs, preferences, and pain points. Through sentiment analysis of calls, chats, emails and social media posts, businesses can assess customer satisfaction and promptly address any concerns, improving overall customer experience and loyalty. Furthermore, image analytics can identify visual cues and sentiment from images shared by customers, helping companies gain insights into how customers engage with their products or services. By proactively addressing customer needs, businesses can establish a stronger foothold in the market and build long-lasting relationships.
3. Competitive Intelligence: Text and image analytics applied on publicly available information online also serve as powerful tools for competitive intelligence. Companies can monitor competitor activities, track mentions, and analyse customer sentiment related to competitors through textual data. This information provides valuable insights into competitor strategies, product offerings, and market positioning. Similarly, image analytics can help identify visual elements associated with competitors, such as logos or brand imagery, aiding in assessing market share and brand perception. Armed with this knowledge, businesses can adjust their own strategies, differentiate their offerings, and better position themselves to gain a competitive edge.
4. Operational Efficiency and Risk Mitigation: Text and image analytics contribute to operational efficiency by automating processes that would otherwise be time-consuming and error prone. For instance, text analytics can automate the categorization and tagging of large volumes of textual data, reducing manual effort, and improving data accuracy. Similarly, image analytics can automate the identification and classification of visual content, streamlining tasks such as quality control or identifying counterfeit products. By improving operational efficiency, companies can reduce costs, optimize resource allocation, and respond quickly to market demands, ensuring survival in a competitive environment.
At listening247, we leverage voice-to-text and image-to-text technology to efficiently process all forms of unstructured data through our social listening and analytics platform platform. This enables us to label the data with custom machine learning models, ensuring the highest possible accuracy, regardless of the original language. In contrast, some vendors offering multilingual text labelling solutions rely on translating everything to English before labelling, which is not an optimal or accurate approach.
Lately, many individuals have inquired about how the listening247 sentiment and topic labelling approach compares to GPT-4 or Bard. The answer is: the listening247 approach is unequivocally better. For a less biased and more objective perspective, I encourage you to refer to this paper. Here is an excerpt from the paper summary:
“The preliminary study shows that ChatGPT and GPT-4 struggle on tasks such as financial named entity recognition (NER) and sentiment analysis, where domain-specific knowledge is required, while they excel in numerical reasoning tasks.”
This subject deserves its own article with a proper gap analysis between LLMs and the proprietary and custom ML models that listening247 creates.
Text, voice and image analytics have become indispensable capabilities for any company striving to survive and thrive amidst fierce competition. The ability to extract insights, enhance the customer experience, gain competitive intelligence, and improve operational efficiency makes these capabilities vital for success. Companies that neglect to harness the power of unstructured data analytics will find themselves at a significant disadvantage, missing out on crucial insights, falling behind competitors, and failing to meet evolving customer expectations. Therefore, to remain competitive in the modern business landscape, organizations must prioritize the adoption and utilization of text, audio and image analytics to secure their long-term survival.
This statement, which I have shared numerous times in previous articles, encapsulates the essence:
“Over 90% of all human knowledge recorded throughout history exists in the form of unstructured data. If your company solely focuses on analyzing and comprehending structured data, it implies that you are utilizing less than 10% of the available data to inform your decision-making processes.”

.webp)
“Pan metron ariston” (παν μέτρον άριστον) is a quote in ancient Greek which was coined by Kleovoulos o Lindios in the 6th century B.C. and means “everything in moderation”. Some believe that the original quote was “Metron Ariston” which means “moderation is best”. Whatever the quote, ancient Greeks believed that you should live your life choosing the mean and avoid the extremes on either side, as much as possible.
Talking about extremes, I have always been fascinated by continua, I think it’s because of the order they bring to chaos and complexity. Almost every ideology or idea that matters in life, can be expressed on a continuum. A continuum has two extremes - let’s think of them as black and white with many shades of grey in between.
Here are two more official continuum definitions which are quite similar:
I do not consider myself qualified to improve on wisdom that transcended centuries (26 centuries since Lindios said “everything in moderation”) but I do have an opinion about quotes that include the words “everything” or “nothing”, “always” or “never”; incidentally these two pairs of opposite words can be the extremes of two continua; very few things are absolute, this is why the quote “everything in moderation... even moderation” may be just short of genius.
There is no doubt that being an extremist has mainly negative connotations: a fascist, a racist, a sexist, a religious fanatic, a communist… There are also some other examples like “feminist” or “atheist” that would create a debate with certain groups - as to whether they have negative connotations - that I am cowardly avoiding to mention at this time (see how I did this :)?).
Let’s first review a few random continua to familiarise ourselves on what they could look like, and after that we will go ahead and discuss the usefulness of looking at an issue through the lens of a continuum. Take the eating continuum below for example, isn’t it amazing how many types of diets there are? It has an impressive 13 elements in addition to the 2 extremes; a total of 15 elements. Kangatarian (I bet you can guess what these people eat :)) is the one that cracks me up with cannibal being a close second! I am also intrigued by how vegetarians managed to be the mean nowadays, they have come quite far from being an extreme in the not too distant past. And in case you are not familiar with ahimsa fruitarians, they only eat fruit that falls off a tree and they call pulling a carrot from the earth murder!
The God continuum with probabilities on God’s existence is not as harmless as the eating one; it is one that has been the basis for so many debates, civilised and uncivilised - and when I say uncivilised I mean the killing type if you think of the Crusaders (even though in their case it was more of a “my God is better than yours” rather than about its existence).
The selfishness continuum comes straight out of the Vedanta Treatise, a Hindu approach to life.
The colour coding means red is bad and green is good for most people.
Disclaimer: this does not always represent the author’s opinion. We will discuss more the groupings or segments of continua in the next chapter.
The continuum below communicates a thesis of mine that most people disagree with. I believe that being a patriot is the beginning of a proverbial “slippery slope”. It could progressively lead to someone becoming a nationalist and then a jingoist which is what you have to be to vote for Brexit or for someone like Trump.
The nationalism continuum can be integrated with the selfishness one at the point of loves all humans which is another way to say world citizen. One can then make interesting connections and draw conclusions about love and nationalism.
Those of you who have read other articles of mine may be wondering what all this has to do with market research, social intelligence, customer insights etc. Well the nice thing about continua is that you can conjure one out of nothing about almost anything. Case in point, digital transformation is something closer to home for a company with a name like ours; listening247. It was a sensible name 10 years ago to communicate specialism in digital market research; today however, when almost everything is digital, a name like this loses its meaning. It’s like calling a car a horseless carriage when in this day and age it is quite obvious that a car does not need horses to move (unlike the 1920s when Ford T1 was launched). But I digress... if you replace physical with ‘brick & mortar’ then this continuum becomes about retail, and if you replace it with ‘analogue’ it could be about equipment.
For market research, physical could mean in-person or telephone interviews, whilst digital means online surveys or unsolicited opinions found on social media using social listening tools.
Nothing easier than creating a 5 point continuum. The one below is about ways of gathering the opinions of customers and other stakeholders. Asking questions refers to surveys and focus group discussions whilst listening refers to unsolicited posts of people online. The discipline of harvesting these posts and analysing them is what we call social intelligence and it is mainly based on machine learning models that annotate posts for topics and sentiment in an automated way.
When you take some time to absorb the 6 examples shared above, you will realise that not all continua are created equal.
Here are some ways to differentiate them:
1. both extremes are bad (ahimsa fruitarian AND cannibal)
2. both extremes are acceptable (asking AND listening)
3. One extreme is really bad the other is really good (fascist Vs world citizen)
4. The mean is a combination of the extremes (asking & listening)
5. The mean is just a standalone option that has nothing to do with the extremes (vegetarian)
So what are they good for? They are philosophical tools that can help organise thought, clear the fog, visualise relationships, pinpoint and explain movements and trends.
Ancient Greeks believed that you should live your life choosing the mean and avoid the extremes on either side, as much as possible. Is this a good principle to follow though? If we consider the various types of continua described in the previous chapter sometimes the best choice is to adopt one of the extremes, sometimes it is indeed the mean like our ancient progenitors preached.
Thinking about moderation, can one be too much of a world citizen or too loving for all creatures
When a continuum describes progress over time it is more likely that the most recent extreme is the best place to be. Even so, living it in moderation is probably a sound piece of advice.
I do subscribe to the notion that life is not black or white, it is mostly grey. Most of our lives are lived in the grey, only very few of us live on the extremes - sometimes by choice, but mostly not. Extremists must always be on edge, in contrast to leading a happy life, laid back, going with the flow, accepting the things they cannot control. Do let me know how you feel about continua and “pan metron ariston” @listening247_CEO or via email.
If you enjoyed reading this article you may also enjoy:
‘How does market research rank on usefulness for human life’

As businesses seek to understand their standing in the digital conversation, listening247's Net Sentiment Score (NSS™) emerges as a pivotal metric. This proprietary formula quantifies online sentiment towards brands, transforming raw social media data and unsolicited customer opinion into actionable insights.
Let’s deep dive into the NSS™ Score and explore its origins, how it operates, and its significance in today's digital-first world.
The Net Sentiment Score™ was developed by listening247 to fill a crucial gap in social media analytics. In a landscape saturated with diverse opinions, it provides a standardised way to assess and compare brand sentiment. This metric is the result of advanced machine learning models that meticulously annotate sentiments as positive, negative, or neutral, ensuring a nuanced understanding of the digital conversation landscape.

Simplicity lies at the heart of the NSS™'s effectiveness. By focusing on the balance between positive and negative mentions and considering the volume of discussions, the NSS™ offers a comprehensive snapshot of a brand's online health. This approach allows for the aggregation of vast amounts of data into a digestible, numerical format, empowering businesses with the clarity needed to navigate the complexities of online reputation management.
This seemingly simple calculation belies the complexity and sophistication of the technology behind it. listening247's algorithms analyse vast amounts of online content, from tweets and blog posts to forum discussions and reviews, employing natural language processing (NLP) and machine learning to accurately capture and categorise sentiments.
The process involves more than just keyword recognition; it delves into the nuances of language, picking up on context, irony, and even regional dialects to ensure the sentiments are accurately interpreted. The result is a score that ranges from -100 (entirely negative) to +100 (entirely positive), offering a clear, quantifiable measure of online sentiment.

The implications of the Net Sentiment Score™ for businesses are profound. It serves as a vital indicator for assessing the impact of social media conversations on brand perception. Here's why NSS™ is indispensable:
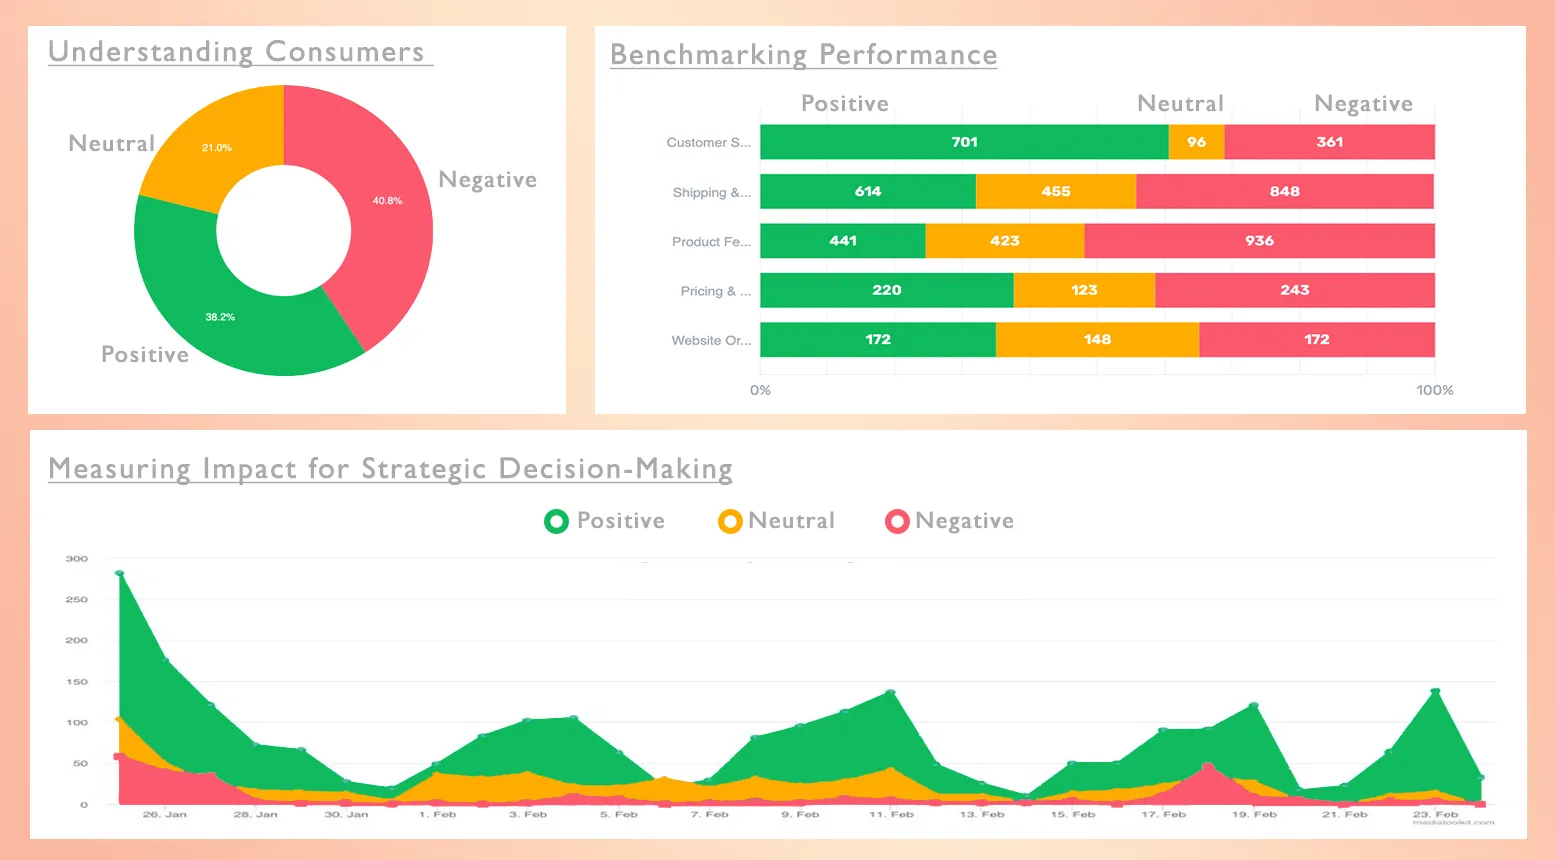
The Net Sentiment Score™ by listening247 represents a significant advancement in the analysis of social media sentiment. Its creation marks a strategic move towards a more informed, data-driven approach to understanding digital conversations. As businesses continue to operate in increasingly digital environments, the NSS™ offers a vital metrics for navigating the complex dynamics of online brand perception. Through its precise, insightful analysis, businesses are better equipped to foster positive engagements, adapt to consumer needs, and ultimately, drive success in the digital age.
To explore the depth of insights that the Net Sentiment Score™ can bring to your brand, we invite you to reach out and request access to your brand health dashboard. The brand health tracking dashboard offers a comprehensive view of your brand's digital presence and sentiment, enabling you to make informed decisions that drive your brand forward.
Whether you're looking to enhance your social media strategy, improve customer engagement, or simply gain a better understanding of your brand's position in the digital landscape, our team is here to guide you through the insights our dashboard can provide. Contact us today to unlock the full potential of your brand's digital narrative.

.webp)
On September 7th we gave the report below to our PR agency and asked them to publish what our analysis of online posts was telling us about Liz Truss.
Sadly, the Queen passed away the next day, so the news cycle moved on from the PM’s election.
The report below was never made public but we decided to post it on our blog and in the form of a Medium article almost a month and a half later as it is an illuminating illustration of the kind of robust AI driven “social intelligence” that is now possible – you can check, at the bottom of the report, the actual posts that were shared.
-----------------------------------------------------------------
This is the 4th report produced by listening247 with data gathered from social media and other public online sources between July 11 and September 6 2022 on Politicians. The 1st report was based on data collected between Sept. 15 and Dec. 14, 2021. The 2nd Dec. 15, 2021 to March 15, 2022 and the 3rd March 16 to July 10, 2022.
The sources of posts included in this report are Twitter, news, blogs, forums, reviews and video.
It is important to make a strong distinction between polls/surveys which are based on a sample of respondents – plenty of those exist and they are not necessarily accurate - and social intelligence which is not based on a sample - this is a unique report and the first of its kind. The data collected by listening247's CXM as well as Social Intelligence and Text Analytics platform are based on the universe of all the posts about the names included in the research (not a sample of posts) and it is the unsolicited opinion of the people who posted these posts – in contrast to polls they were not paid to answer questions, so they had no incentive to cheat or write an opinion that was not theirs.
The main KPIs used to rank the subjects of this research were:
In the table below the 3 politicians are ranked based on total number of posts from all sources.
It is now the 3rd time that the total number of posts or share of voice is predictive of who will win an election.
In the previous report we published Rishi was leading in this metric and he was the one elected with the highest number of MPs. Now from July 11 to September 5th the tables turned. Liz has more than double as many posts as Rishi and won the vote of the 170,000 conservative members.

In terms of net sentiment score during the 24 hours post Liz’s election the ranking is almost turned on its head.
Keir has positive 3% whilst Rishi Sunak is closer to him with negative 3% and Liz has negative 8% a whole 11% worse score in public sentiment than the leader of the Labour Party.
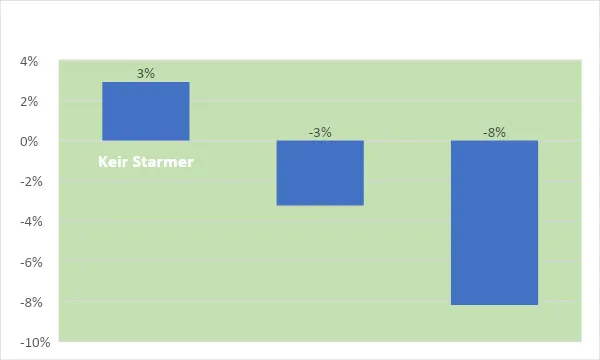
The examples of posts below are a representative sample of what most people post about the next national election in January 2025:
It is quite clear that they all think Liz was the worse PM to go against Keir.
Three numbers are very important to keep in mind and understand what they represent:
The two final candidates (Liz+Rishi) of the conservative PM race were selected in multiple voting iterations by ~350 conservative MPs.
On September 5th ~170,000 conservative members voted and elected Liz Truss as the Prime Minister.
The total electorate for parliamentary votes in the UK has over 46 million voters.
Our report reflects the opinions of the 46 million voters; thus, the ranking may be able to predict what would happen if the vote for the election of a conservative PM was put to a national vote yesterday. To better interpret our rankings above we should keep in mind that in 2022 around 85% of the UK population are social media users.
From that we can infer that the online posts gathered from various sources between March and September this year may impact up to 85% of the voters; it could be a bit less because the older population who do not have access to social media are all voters whereas the 85% (people with access to social media) includes children below 18 who are not voters yet. Having said that online News is one of the sources (the media) which is editorial and impacts the opinions of everyone who are exposed to the media.
The discussion in our previous report about possible scenarios was inferring that the conservative members should pay attention who was the most likely candidate to win the national election in January 2025 and let that inform their decision.
Unfortunately, they did not do that.
The social media data indicates that Rishi would have a better chance to beat Keir.
The question now is if this data was predictive for the last two finalists and for the September 5th vote - which it was - will it also be predictive for the national election results in 2025? It looks like it is when 2 out of 2 times the share of voice predicted the outcome!
Stay tuned for more data from listening247 on the subject.
----------------------------------------------------------------
This is what we wrote on September 7th, 2022. I think for the 4th time unsolicited citizen opinion from social media and other online sources proves to be much more predictive than polls which are based on samples of respondents (who sometimes lie and sometimes forget what they said or did a week ago) that may not be representative.
We think that it is about time for social media listening and analytics to take its rightful place in the political forecasting business.

.webp)
AI can boost Call Centre Efficiency and Customer Satisfaction.
Call centres are a vital part of many businesses, providing customer support and assistance. In recent years, the use of artificial intelligence (AI) has become increasingly prevalent in the call centre industry, and for good reason. By leveraging AI, call centres can increase revenue and improve their overall performance.
Throughout the rest of this blog post we will use “Contact Centres” instead of “Call Centres” as it is a more appropriate description of what these organisations do. They do not just respond to calls but also to chat messages, emails and sometimes even social media posts.
Call centres can leverage AI in a variety of ways to reduce cost and even increase their revenue. By automating customer interactions, using predictive analytics, improving call routing, and analysing customer feedback, call centres can improve their efficiency, reduce costs, and provide better customer service. As AI technology continues to advance, the opportunities for call centres to use it to increase revenue will only grow.
listening247 uses proprietary machine learning models on its AI platform that are customised for each subject or product category, achieving a minimum accuracy of over 80% each time, in any language. Often, the accuracy is over 90%, depending on the amount of training data used for the custom models.
While there are ML models available for anyone to use (e.g. open source, Google, AWS and Microsoft), free or paid, the problem with those is that they are generic to a language, which means not specific to a product category. Thus, they can never reach acceptable accuracies without custom training data as top-up. Typically, their accuracies linger below 70% at best and usually around 50%-60%.

Social media for over a decade now have established themselves as a powerful tool for marketers to reach out to their target audience and promote their brands. With the rise of social media platforms such as Facebook, Twitter, Instagram, YouTube, Reddit and TikTok businesses have found new ways to reach out to their customers. However, the success of social media campaigns can be difficult to measure. In this post, we will discuss the best way of evaluating the performance of social media campaigns.
Traditionally, brands have used tracking surveys to evaluate frequent campaigns. For ad-hoc campaigns these surveys were conducted before and after to measure changes in brand awareness, perception, and loyalty. While these methods can be useful, they are time-consuming and expensive. Moreover, it can only provide a limited understanding of the impact of a campaign.
One of the main limitations of using surveys for evaluating social media campaigns is that they are based on a sample of respondents. In other words, only a small group of people are asked to provide feedback on the campaign. Some of them agree and some don’t. This can lead to biased results and make it difficult to draw meaningful conclusions about the campaign's impact on the broader population.
In contrast, social media listening and analytics allows for a more comprehensive analysis of the campaign's impact. This method involves monitoring all the posts and mentions related to the campaign, rather than relying on a small sample of respondents. This provides a more accurate and representative view of how the campaign is being received by the public.
Social media listening involves monitoring social media platforms for mentions of a brand, product, or service. This method can provide real-time feedback on the effectiveness of a campaign. Machine learning for text analytics, on the other hand, can help analyse large volumes of data and identify patterns and insights that would be difficult to detect manually.
One of the most effective ways of evaluating social media campaigns is by tracking engagement metrics. Engagement metrics include likes, comments, shares, and clicks. By monitoring these metrics, brands can determine how well their content is resonating with their target audience. Moreover, engagement metrics can help brands identify which platforms and types of content are most effective for their audience.
Another important metric to track is conversions. Conversions refer to the number of people who take a desired action, such as making a purchase, after seeing a social media post. By tracking conversions, brands can determine the ROI of their social media campaigns.
Furthermore, social media listening and analytics can help brands identify patterns and insights that would be difficult to detect through traditional surveys. Machine learning algorithms can analyse large volumes of data and identify trends and themes that may be missed by manual analysis. For example, sentiment analysis can help brands identify whether the overall tone of the conversation about their campaign is positive, negative, or neutral, and adjust accordingly.
It is important to measure the reach of social media campaigns. Reach refers to the number of people who have seen a post. By tracking reach, brands can determine how far their message is spreading and identify opportunities for growth.
Finally, social media listening and analytics can be more cost-effective than traditional surveys. While surveys can be time-consuming and expensive to conduct, social media listening and analytics tools are often more affordable and accessible. This makes it easier also for smaller companies to monitor their campaigns and make data-driven decisions.
Surveys and social media listening produce different metrics for evaluating social media campaigns. While surveys can provide valuable insights into how customers perceive a brand, social media listening can offer a more comprehensive and real-time view of a campaign's impact. Here's a comparison of some key campaign evaluation metrics produced by surveys versus social media listening:
My usual stance is that social media listening, or the practice of monitoring unsolicited customer opinions, can serve to enhance and complement survey results, which rely on solicited customer opinions. However, there are instances where I strongly believe that surveys are not the most effective way to gather feedback. For example, when assessing the impact of an advertisement on social media, it doesn't make sense to rely solely on a small group of survey participants who agreed to give their opinion for a fee. Instead, we can leverage social media listening to gain insights from all the individuals who actually saw the ad online and freely expressed their thoughts about it. By doing so, we can obtain a more accurate and comprehensive understanding of the ad's reception among the target audience.
While traditional methods of evaluating social media campaigns can still be somewhat useful, there are now more effective and efficient ways to measure performance. Social media listening and machine learning for text analytics have made it easier to track engagement, conversions, sentiment, and reach. This method provides a more comprehensive analysis of the campaign's impact, allows for real-time feedback, and can be more cost-effective. By using these metrics, brands can gain a better understanding of the impact of their campaigns and make data-driven decisions to improve their brand strategies.
“You don’t have to be a major multinational brand to be able to afford social media listening, as a matter of fact such an approach is way cheaper than the traditional one.”

.webp)
The discovery of emerging trends has become increasingly important in recent years. Product development and innovation executives are constantly searching for ways to predict what consumers will want before their competitors. In this post, we will explore how trend discovery was done in the past, and more importantly, we will highlight cutting-edge Natural Language Processing technology that can help you identify emerging trends before they become mainstream.
The process of discovering consumer trends has undergone a massive transformation over the past 15 years, primarily due to the advent of social media and Artificial Intelligence.
In the past, companies had to rely on traditional market research methods that were time-consuming and expensive. However, with the rise of social media listening tools, it has become much easier for companies to track and analyse consumer behaviour, preferences, and opinions. In this post, we will explore the challenges faced by companies in discovering consumer trends 15 years ago, compared to the ease with which it can be done now.
To be more specific, in the past, companies relied primarily on surveys and focus groups to understand their customers. These traditional methods were often expensive, time-consuming, and had a limited sample size. Companies had to go through a rigorous process of recruiting participants, conducting the survey or focus group, analysing the data, and then interpreting the findings. This entire process could take weeks or even months to complete, making it difficult for companies to innovate and be competitive.
Moreover, surveys and focus groups were often limited to a specific geographic area or demographic, making it difficult to get a broad understanding of consumer behaviour. This lack of data often led to companies making assumptions about their customers' preferences, which could result in costly mistakes.
According to various studies, the failure rate for new products is estimated to be between 70% and 90%. In other words, most new products that are launched fail to achieve their business objectives, such as generating sufficient revenue or profitability. This underscores the importance of conducting thorough market research, testing, and analysis before launching a new product to increase the chances of success.
With the rise of social media, companies now have access to a wealth of data that can be used to uncover consumer trends. Social media platforms like Facebook, Twitter, and Instagram have billions of users, and each one of them is creating content, sharing opinions, and engaging with brands. Social media listening tools have made it easier for companies to monitor these conversations and extract meaningful insights.
Social media listening tools allow companies to track specific keywords and hashtags related to their brand or industry. These tools analyse the data and provide valuable insights, such as sentiment analysis, conversation drivers, engagement metrics and virality. This information can be used to identify emerging trends, monitor brand reputation, and engage with customers in real-time.
In addition, social media listening tools allow companies to track their competitors' activities, which can provide valuable insights into their marketing strategies and product development. By monitoring their competitors, companies can identify gaps in the market, and create products or services that meet the needs of their customers.
Furthermore, social media listening tools have made it possible for companies to connect with their customers in a more personalized way. By monitoring social media conversations, companies can identify individuals who are influential in their industry or have a large following. These individuals – the influencers - can be targeted to become brand advocates or ambassadors and to propagate offers, which can lead to increased engagement and more sales.
listening247 has developed a proprietary approach to discovering emerging trends that involves the following steps:
By using this approach, listening247 provides valuable insights into emerging consumer trends that can help companies stay ahead of the competition and better understand their customers.
The process of discovering consumer trends has evolved significantly over the past 15 years, thanks to the rise of social media listening tools such as our Social Listening and Analytics Solution. These tools have made it easier for companies to monitor and analyse consumer behaviour, preferences, and opinions. They have also provided valuable insights into competitors' activities and enabled companies to connect with their customers in a more personalized way. With the help of social media listening tools, companies can stay ahead of the competition and create products or services that meet the evolving needs of their customers.

.webp)
They say a picture is worth a thousand words. Perhaps even more judging from the graphs below and the compelling story they tell on bank performance!
In October 2021, listening247 carried out a social intelligence (SI) project about banks in Portugal, it’s 5th project in the industry, to illustrate the value of unsolicited customer opinion to a bank’s management.
The opinions were “unsolicited” in the sense that no one asked anyone a question; the only source used was online sentiment as expressed on Twitter, Facebook, blogs, forums, videos, reviews and the news.
25,758 unique posts were gathered about 13 banks from all these sources from September 1st , 2020 to August 31st, 2021.

Novo Banco has the highest share of voice at 54% followed by MIllenium BCP with 40% and Santander with 18%. On the other end of the positive-negative spectrum, we have four banks each with fewer than 200 posts in an entire year.
The question is: is it a good thing to have the highest share of voice (SoV) in a competitive market?
Not necessarily…it depends!
In the case of Novo Banco, the SoV is bad news. Most of the posts about them express negative sentiment – the red bars on our graph express a net sentiment scoreTM (NSSTM).

The NSSTM basically means that there are more negative posts than positive, for 8 out of the 13 banks included in the analysis.
Caixa Central has the worst NSSTM at -46% followed by Novo Banco with -42%.
So, what is the reason for the negative sentiment?
Well, it is mainly about the customer experience – a whopping 16,881 posts - and Novo Banco leads with 51% share of negative sentiment, considerably more than the corresponding score for Millenium BCP (24%). The 3rd highest share of negative CX was for Santander.
Interestingly, Santander is one of the 5 banks with positive NSS overall, perhaps on account of their active Facebook presence and higher customer engagement.
However, if we just look at the news, Santander’s NSS is slightly negative at -4% albeit still way better than the corresponding figure for Novo Banco (-45%).

In Fig.4 below we compare the NSS for Portugal’s main banks with other industries and product categories as well as with selected global banks.
What transpires is that banking in Portugal is among the three worst sectors in terms of negative sentiment along with public transportation in the UK and telecommunications in the Netherlands. Even within banking, Portugal’s lag in performance (compared to other countries or regions) is starkly evident.
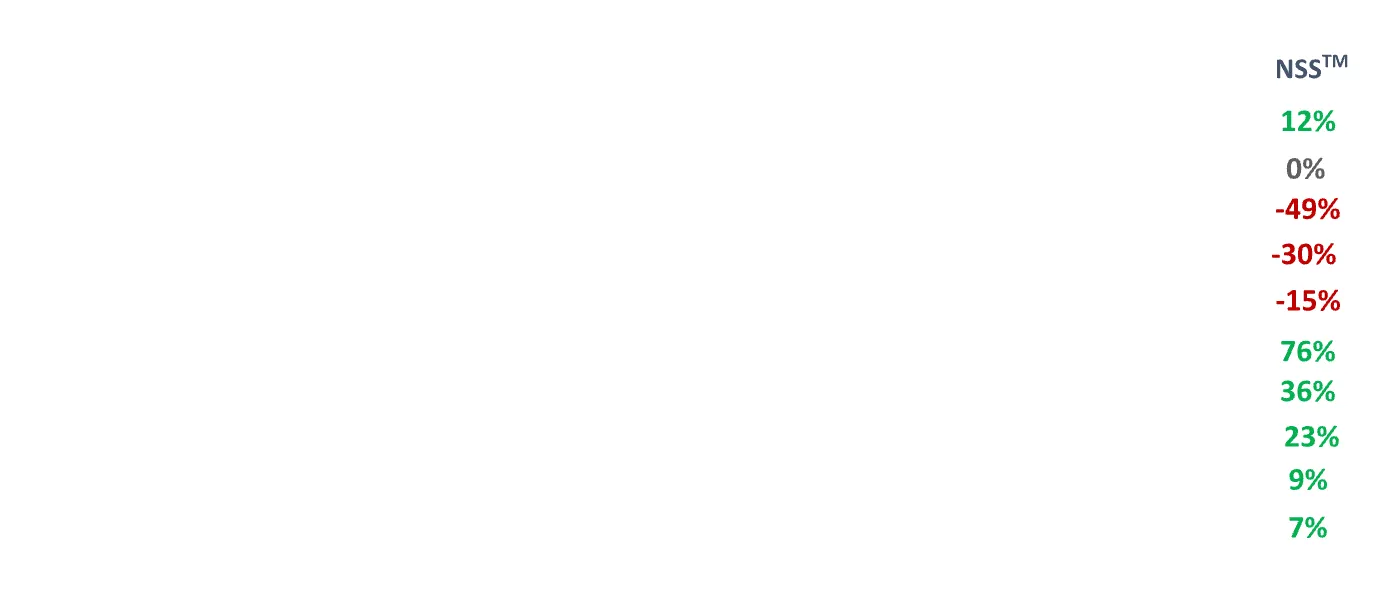
Fig 5. below - for 11 Global Banks - is the equivalent of Fig. 2 where we show the NSS ranking for Portuguese banks. The difference could not be starker; the red is replaced by green – which means that 10 out of 11 banks have positive NSS albeit recorded one year earlier than for Portugal.
To be fair, the sentiment towards banks seems to change drastically depending on the economic situation. Negative sentiment appears to get a boost during an economic downturn or a recession. It improves when times get better.

Most traditional bankers are very slow to adopt innovation perhaps because they are trained to be risk averse. Unsurprisingly, when we showed Fig. 2 to a number of Portuguese bankers their reaction was to immediately question the validity of the data. What is more, they asked to see proof that negative NSS has bottom line implications for those banks.
Peter Nathanial the Board Chairman of DMR and former Group Chief Risk Officer of the Royal Bank of Scotland said about the report: “Social intelligence sourced insights seem to polarise board members and top executives of banks everywhere; at one end, people remain unconvinced that social intelligence provides any insights and want to see proof or causality with their business performance, whilst at the other end, people believe that this data is very powerful and definitely needs to be an important part of their future decision-making process. If the first group is right, then the second group is moving too soon. However, if the second group is right, the first group – and their institutions - will be left behind.”
We do not have proof of a causal link to their bottom-line performance yet, but we do have the next best thing: data that shows extremely high correlation of sentiment expressed in news and social media with the banks’ stock price.
Check out the last figures below (Fig. 6 & 7) from our report with 11 Global Banks in 2019, which also serve as the conclusion of this post.


I am tempted to say I rest my case. What do you think?

.webp)
Most people prefer order to mess, hardly a surprising conclusion.
A score that enables ranking in multi-player environments provides order and the ultimate gamification. Ideally it should be a composite score. This is a score that combines multiple metrics in one all-encompassing index.
Gamification does not mean turning a serious activity into a game; it is using gaming techniques to provide participant motivation and make the activity more fun overall.
I do like to think of business as a game. Some people take it too seriously, to the extent that it has a pathological effect on them – it affects their health in a negative way. Business is not a life-or-death endeavour. Winning is fun, losing is dreadful (worse for bad losers like myself) but it is not the end of the world.
So, let us break down how the SPS is calculated and its benefits for brands and for individuals; starting with the business perspective.
Brands and their parent organisations are always looking for the ideal KPIs that will drive their performance. NPS was once hailed as the single metric a company needed to measure and predict its future performance. NPS stands for Net Promoter Score and it is produced via a single question to customers, usually delivered via a survey: On a scale from 0-10 how likely is it that you would recommend Brand X to your friends and colleagues?
All those who provide a score between 0-6 are considered detractors, whereas the 9s and 10s are considered promoters; the 7s and 8s are polite negatives or passives at best.
The calculation of this composite score is as follows NPS=((promoters-detractors)/all respondents) X 100, with scores ranging from -100 to +100.
A similar idea applies to the Social Presence Score (SPS) for brands; however, its calculation is not as straightforward. Several social intelligence metrics have been considered by our data scientists and our conclusion was to use the following:

The SPS can have a value between 0 and 1 (see Fig.1 above); it is calculated, for a certain period of time, as one aggregated metric for multiple brand posts; it can be offered as a single score from all source types, or for individual ones such as Twitter, Facebook, Instagram, YouTube or Tik Tok (see Fig.2 below).
There is a secret sauce that even if I wanted, I would not be able to adequately describe in a mainstream article, and that is the weighting of the above-mentioned metrics in the SPS. Not only that but also the entire process, starting before the online posts are annotated, to eliminate irrelevant posts due to homonyms i.e.clean the data and remove the noise.
The benefit of having a score like this as a brand is, not surprisingly, the ability to:

The motivation to track a social presence score is not that dissimilar for individuals. Influencers and other high profile individuals want to know how their personal brand is doing compared to others and where they rank.
The metrics we use to create the composite Social Presence Score for individuals are similar but not all the same as for brands (see Fig.3 below):
The benefits for a person to know their SPS are:

It goes without saying that even if the SPS is perfectly synthesised with its composite metrics, the accuracy of the individual metrics included must be measurable and acceptable. It is always possible to reach over 80% accuracy for sentiment, topic and brand relevance annotations.
So, what do you think?
Would you like to know your SPS in relation to others?
I know I would; I miss having one since klout score ceased to exist.
Social presence score (SPS) comes to the rescue; it is the new single KPI for brands and individuals based on all online mentions - not just a sample – that can be used to measure the overall success of their marketing efforts.
Unlike one of my recent blog posts titled Social Listening - Social Analytics - Social Intelligence, the 3 bigrams in the sub-heading are not part of a continuum, they are synonyms.
Synonyms are words that do not necessarily look or sound alike, but they have more or less the same meaning, while homonyms are words which are spelled the same, although they mean different things.
For the social intelligence discipline, synonyms and homonyms are treated in a diametrically opposite manner: the former are included when gathering online posts whilst the latter must be excluded; failure to do so results in another bigram we so often use in the data analytics business: “Garbage-in…”!
Sometimes, depending on the popularity of the homonyms, more than 80% of the posts gathered - using a social media monitoring tool are irrelevant - referred to as “noise” (as opposed to signal). Only if we have a way to remove the noise can we avoid completing the popular saying mentioned in the previous paragraph with: “…Garbage-out”.
But I digress…
This post is about efficient and meaningful ways to integrate unstructured and eventually structured data sources as part of an organisation's customer experience (CX) measurement or customer management (CM) process - a relatively new more encompassing term gaining ground on CX - in order to discover actionable insights.
This new process of beneficial unstructured data fusion from multiple source types can be described in the following 8 steps:
First a quick reminder as to what constitutes unstructured data:
Text analytics is the easiest to perform (as opposed to audio analytics for example) hence the idea to transform all forms of unstructured data to text for easier manipulation.
One of the most useful sources of unstructured data for businesses is their call center audio recordings, with conversations between customers and customer care employees. These audio files can easily be transformed to text (voice-to-text) using specialised language specific machine learning models. An accuracy metric used for the transcripts produced is WER=Word Error Rate which should be lower than 10%.
Another popular source of insights are images e.g. posted on social media or shared on a business client community. A deep learning model adequately customised can produce a caption describing in text what is illustrated in each image (image-to-text).
When it comes to video, a combination of voice-to-text and image-to-text tech can be used.
When all sources of unstructured data are turned into text, they then need to be uploaded onto a text analytics platform, usually in the form of a JSON or CSV file.
If the same platform has the capability to provide data from additional sources, such as online posts (text and images) from Twitter, Facebook, Instagram, YouTube, reviews, forums, blogs, news etc. so much the better. It can serve as both a social intelligence and text analytics platform.
If needed, text from each source type can be uploaded or gathered and saved separately and merged at a later stage, so as to take a bespoke approach to cleaning and subsequently annotating the text using custom machine learning models for each source.
When it comes to client/user owned data they are all intrinsically clean (read relevant) since the source types are:
As for the data gathered from online sources – what is commonly known as social listening or social media monitoring – that is where a thorough data cleaning process is required. The problem as already indicated above is the homonyms. When a Boolean logic query is created to gather posts from social media and other public online sources, using a brand name like Apple or Coke or Orange as a keyword invites a lot of “noise” as you can imagine. The platform is required to offer easy ways to eliminate posts about apple the fruit, cocaine and orange the colour or fruit..
There are two ways to get rid of the irrelevant posts which sometimes make up more than 80% of all posts gathered.
If data cleaning is done properly, we can expect brand/keyword relevance over 90%.
Natural language processing is the umbrella discipline that takes care of this step in the process. Ideally the use of machine learning models to annotate text in any language works best, but sometimes a rules-based approach may be a shortcut to enhancing the annotation accuracy.
A good text analytics tool offers multiple options i.e. the ability to train generic & custom unsupervised machine learning models or using native language speakers as well as a taxonomy creation feature using a rules based approach.
Text can be annotated for sentiment, topics, relevance, age or other demographics of the author (if not otherwise obtainable), customer journey etc. A minimum accuracy of annotation should be declared and aimed for, and the users need to be able to easily verify the annotation accuracy themselves.
This step can happen before or after the merging of the various data sources, depending on their homogeneity.
For the longest time data fusion or integration or merging from different sources meant weeks or months of data harmonisation, so that the different sources could fit together and make sense. Merging 5-10 source types of unstructured data after steps 1-3 above only takes a few minutes, not months. It would take a few hours from start to fusion.
A powerful filtering tool is required for the user (data analyst) to be able to drill down into the data and discover interesting customer stories which might lead to actionable customer insights. For example, the user could first filter for negative sentiment, then for a specific brand, after that a topic and finally a source type before they start reading individual interactions to get an in-depth understanding of the WHY and the SO WHAT.
Once the data is cleaned, merged, annotated, and explored, it can be delivered in multiple ways such as:
Data visualisation via PowerPoint slides, drill down or query dashboards and alerts work best. Ideally the data formats should be flexible so that they can work with multiple data visualisation tools.
For now, data fusion included in a CX/CM program is a better fit for larger corporations, for two reasons:
Hopefully soon there will be versions of SaaS products that will make this process efficient and inexpensive enough for SMEs (SMBs) to be able to afford it.
That is what we call the democratisation of data analytics and market research.
The more data sources we integrate the more likely it is for a data analyst, the user of a tool such as listening247, to be able to synthesize actionable insights in their true meaning.
It seems that the biggest gain from this newly found ability to accurately annotate text in any language and fuse/integrate/merge from any source type in a matter of hours is in the discipline of customer experience (CX) measurement and management (CM).
CX and CM are increasingly seeking to encapsulate market research, business intelligence, customer care and other business disciplines and are meant to perfect the customer path to purchase, minimise brand defectors and maximise the number of advocates.


S-L-A-I
Social Listening, Social Analytics, and Social Intelligence - are they the same or are they integral parts of a sequential process, a so-called continuum?
Quite a few pundits have discussed this question in their articles, blogs, and essays. The most controversial of the three is social intelligence; if you Google it you will find its Wikipedia definition on first position explaining that it is “the capacity to know oneself and to know others”.
Of course, the alternative definition, the one that was coined after social media monitoring and analytics became popular only appears on page four of Google search - which you would only know if you are me and you search for social intelligence. In this secondary context, this bigram* means: the knowledge and insights that organisations can extract from online posts (mainly on social media platforms) published by their customers and other stakeholders.
The precondition to get to actionable insights is to avoid “Garbage-in” during the so-called data harvesting process, and to use appropriate machine learning models to maximise the accuracy of brand, topic, and sentiment annotation.
But let us look at the three bigrams one at a time,*combination of two words.
Social listening is short for social media listening, and to some a synonym of social media monitoring. Most people use social listening as an all-inclusive term for all online sources from which online posts can be gathered or harvested. However, in addition to popular social media platforms such as Twitter, Facebook, Instagram, YouTube, we also can harvest data from blogs, forums, news, and reviews. There are other sources that are country specific, such as Weibo for China and VK for Russia.
It is of paramount importance to harvest for all synonyms and avoid all homonyms (garbage-in) which can be over 80% of all harvested posts. A homonym is a word that is spelled the same way as the keyword for harvesting but means something entirely different, which makes it irrelevant for the project at hand. The classic example used to explain this problem is: wanting to harvest posts about Apple the company but ending up with lots of posts about the fruit or juice; let alone Apple Martin who is Gwyneth Paltrow’s daughter and if not excluded will invite a lot of noise in the dataset rendering it not only useless but dangerous for the user!
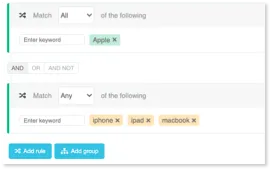
Social analytics is what happens after the posts are harvested from the various sources and irrelevant posts are removed as “noise”. For data analysis to take place, accurate intelligence needs to be added to the dataset using machine learning and/or rules-based NLP methods. The most common annotations added to each post or relevant snippet within the post (this is a longer story that requires its own blog post) are: brand, sentiment, emotions, and topics/subtopics/attributes.
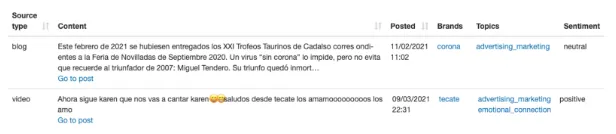
These annotations can be added for text in any language, and the accuracy sought after – measured in precision, recall and F-score – should be over 75% in all cases. It is even possible to reach F-scores that are over 95% with focussed and context related training of suitable machine learning algorithms.
Social intelligence is the wisdom discovered by exploring the intelligent dataset. You see, adding brand, sentiment, emotion, and topic annotations to a dataset makes it “intelligent” but in order to find wisdom or “actionable insights” a lot more than just accurate annotations is required.
For the time being, an intelligent data cruncher and a powerful filtering or drill down tool is still needed to explore a dataset and find the gold nuggets.
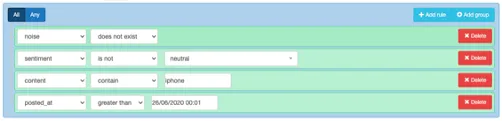
We like to think of the listening247 unstructured data analytics platform also used for social listening, as the Google Maps of big data. It enables a user to navigate in a maze of millions of online posts - or other documents for that matter - safely and accurately from A to B; B being the destination or in our case the actionable insight. The path to finding the actionable insight is oftentimes a data story worth telling.


It was a lightbulb moment during lockdown; a few days after the team completed a piece of work, it suddenly hit me. Online posts from Twitter, Facebook, Instagram, blogs, forums, news, reviews and videos were fused with call centre audio files and survey verbatims in just 3 days, done for the first time and done right. Albeit from very different sources, involving both solicited and unsolicited opinion, this data had something in common - it was all unstructured data.
When I compare the amount of effort that is required to integrate structured data, with what we experienced integrating text and audio (unstructured data) during the “light bulb event” the contrast could not be more surprising!
If you are dealing with numbers in tables, you’re looking at column headings, product names, units and rigid time periods, so integrating various sources means that everything should be harmonised, for example:
Harmonising structured data to import it into one platform and then further manipulate it to integrate the various sources in order for meaningful analytics to be possible takes weeks, sometimes even months, compared to the 3 days to import, integrate, annotate, and explore unstructured data from various sources.
With unstructured data the integration process is simple; all data in text format can be annotated for relevance, brand, sentiment and topics in an automated way using machine learning models or taxonomies. Data in other formats (such as image or audio) can be converted into text in order for the same process to follow. This makes it possible to annotate call centre conversations or images from social media, just as easily as text in online posts and responses to open ended questions from surveys.

Fig. 1 Ingesting survey verbatims on listening247
The difference that makes all the difference (pun intended) when it comes to integrating structured vs unstructured data is that with the former the intelligence is already an added layer before the data fusion takes place, whilst with the latter the text is ingested and integrated before consistent intelligence is added to the dataset as a whole e.g. brands, sentiment/emotions and topics. Once the data is integrated it is already homogeneous (since it is all text) so it is straightforward to annotate it using custom or generic machine learning models and taxonomies - without having to worry about harmonisation.
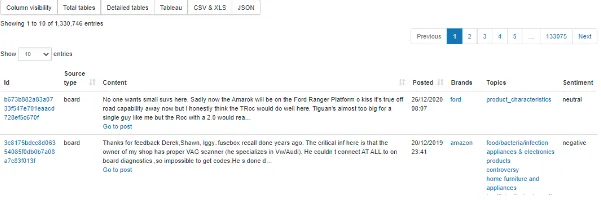
Fig 2. Annotated online posts with brand topics and sentiment on listening247 Data Explorer
There are some obstacles to integrating and annotating unstructured data other than text such as audio that needs to be transcribed and images that need to be captioned with text; only when that happens can the accurate annotation of all the integrated data sources take place. There are even more obstacles if the data to be fused involves multiple languages.

Fig. 3. Image caption example, image-to-text
Thankfully, technology is available to enable voice-to-text and image-to-text transformation, as well as accurate annotations. Without accurately adding layers of intelligence, big data and especially text is not only useless, but with the wrong labels also harmful.
A data analyst cannot be expected to read millions of online posts, but what they can do is use a smart filtering tool to drill down and explore the annotated documents (e.g. social media posts or call center threads) and discover the “gold nuggets”, the elusive actionable insights.
The future of unique and actionable insights lies in data fusion of unstructured + structured data. Some of this data will belong to the companies e.g. sales data, and some they will need to procure e.g. 3rd party online posts or survey results.
Integrating unstructured data is more effortless and straightforward than you might think. You only need a good unstructured data analytics tool.


